This is the transcript of the video talk Better programming tools, ep04 - Call graph navigator
<< Back to index
Welcome back to these short talks on ideas for better programming tools. If you want a proper introduction, watch the first episode in the series. Otherwise, let's dive right in.
Today's idea is a good call graph navigator. See which functions call which other functions, but in a way that's not an overwhelming tangled mess, even if your code is.
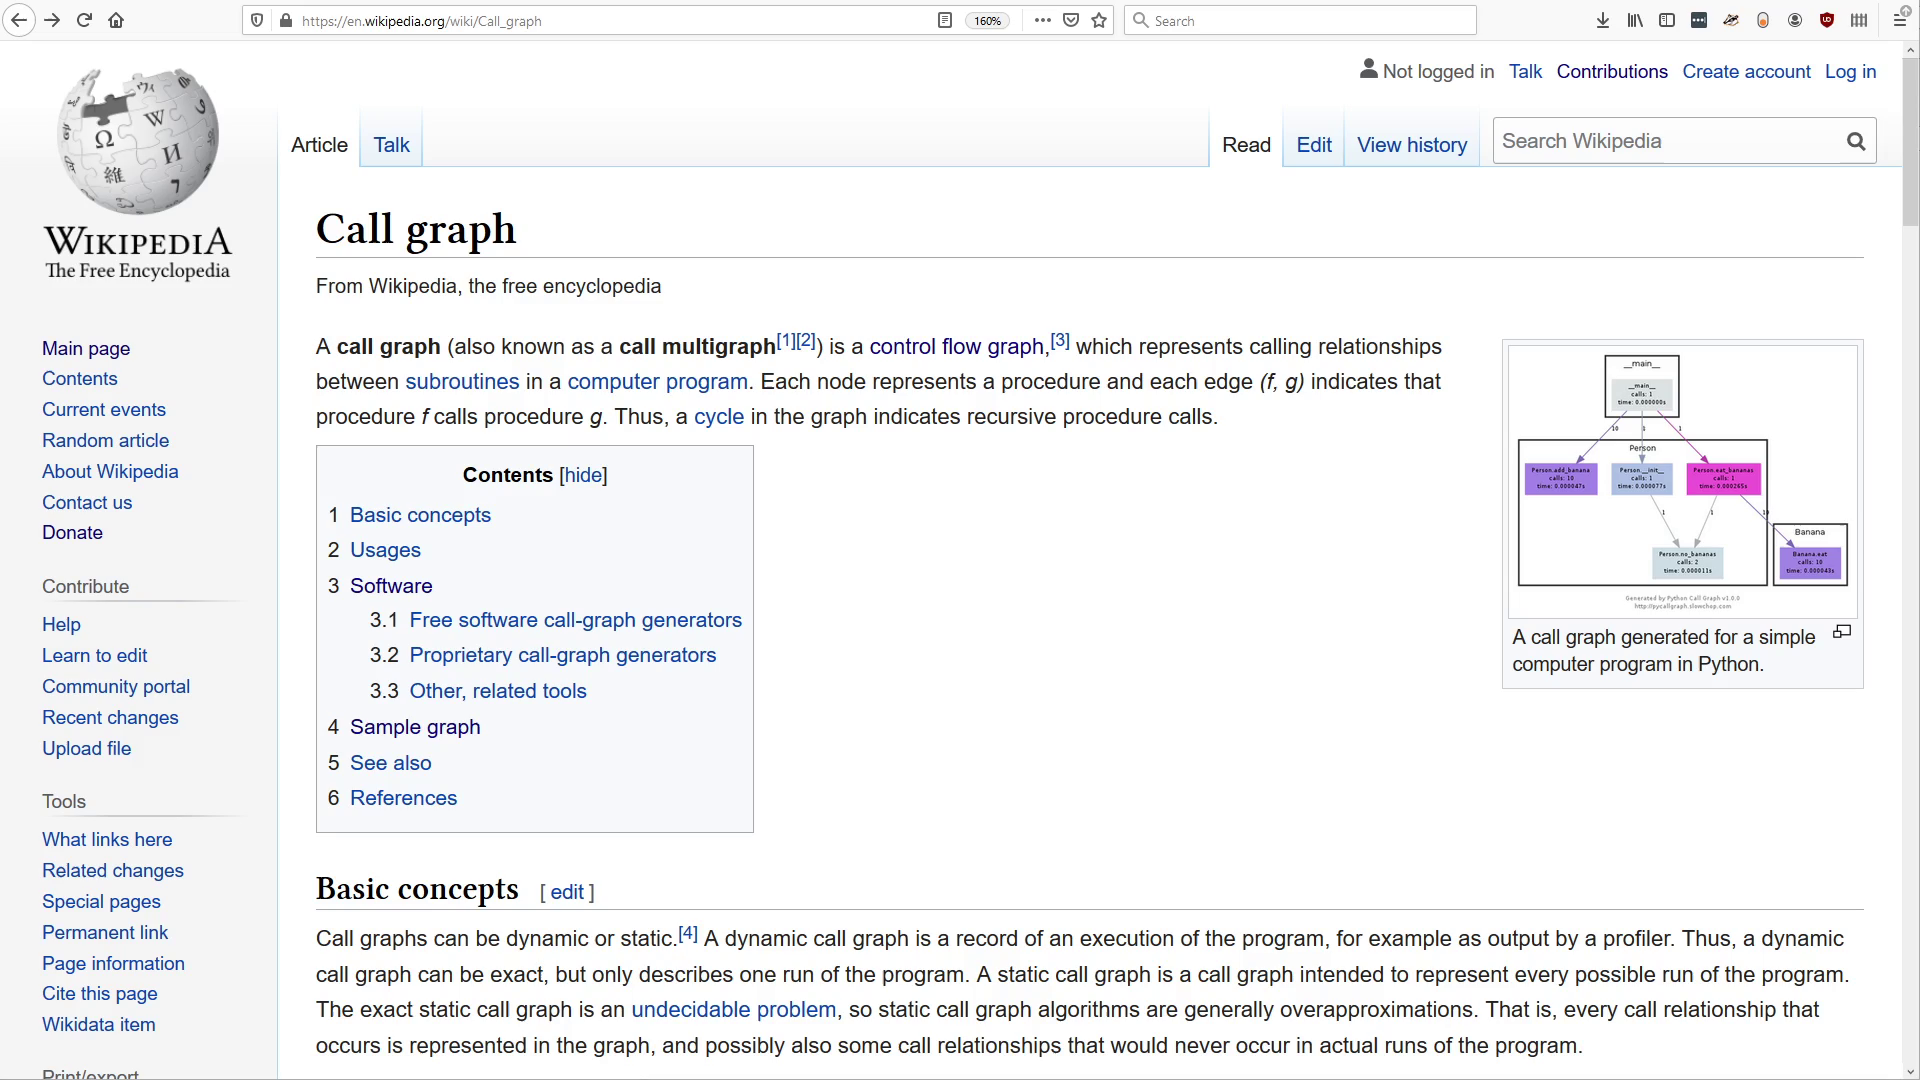
You might already be familiar with the concept of a call graph. I'm not presenting a brand new idea here. There are already many tools that will let you view a call graph for your code. But I think most programmers don't use those tools because they aren't good enough, and that's a shame, because call graphs could be really valuable.
First we'll look at some examples of existing tools, and I'll explain some of the problems I see in them, and then I'll show you my ideas.
"Note. The completeness (and correctness) of the call graph depends on the doxygen code parser which is not perfect."
Ok, so doxygen doesn't have a complete understanding of the language and might parse it incorrectly. Let's keep looking for a better tool.
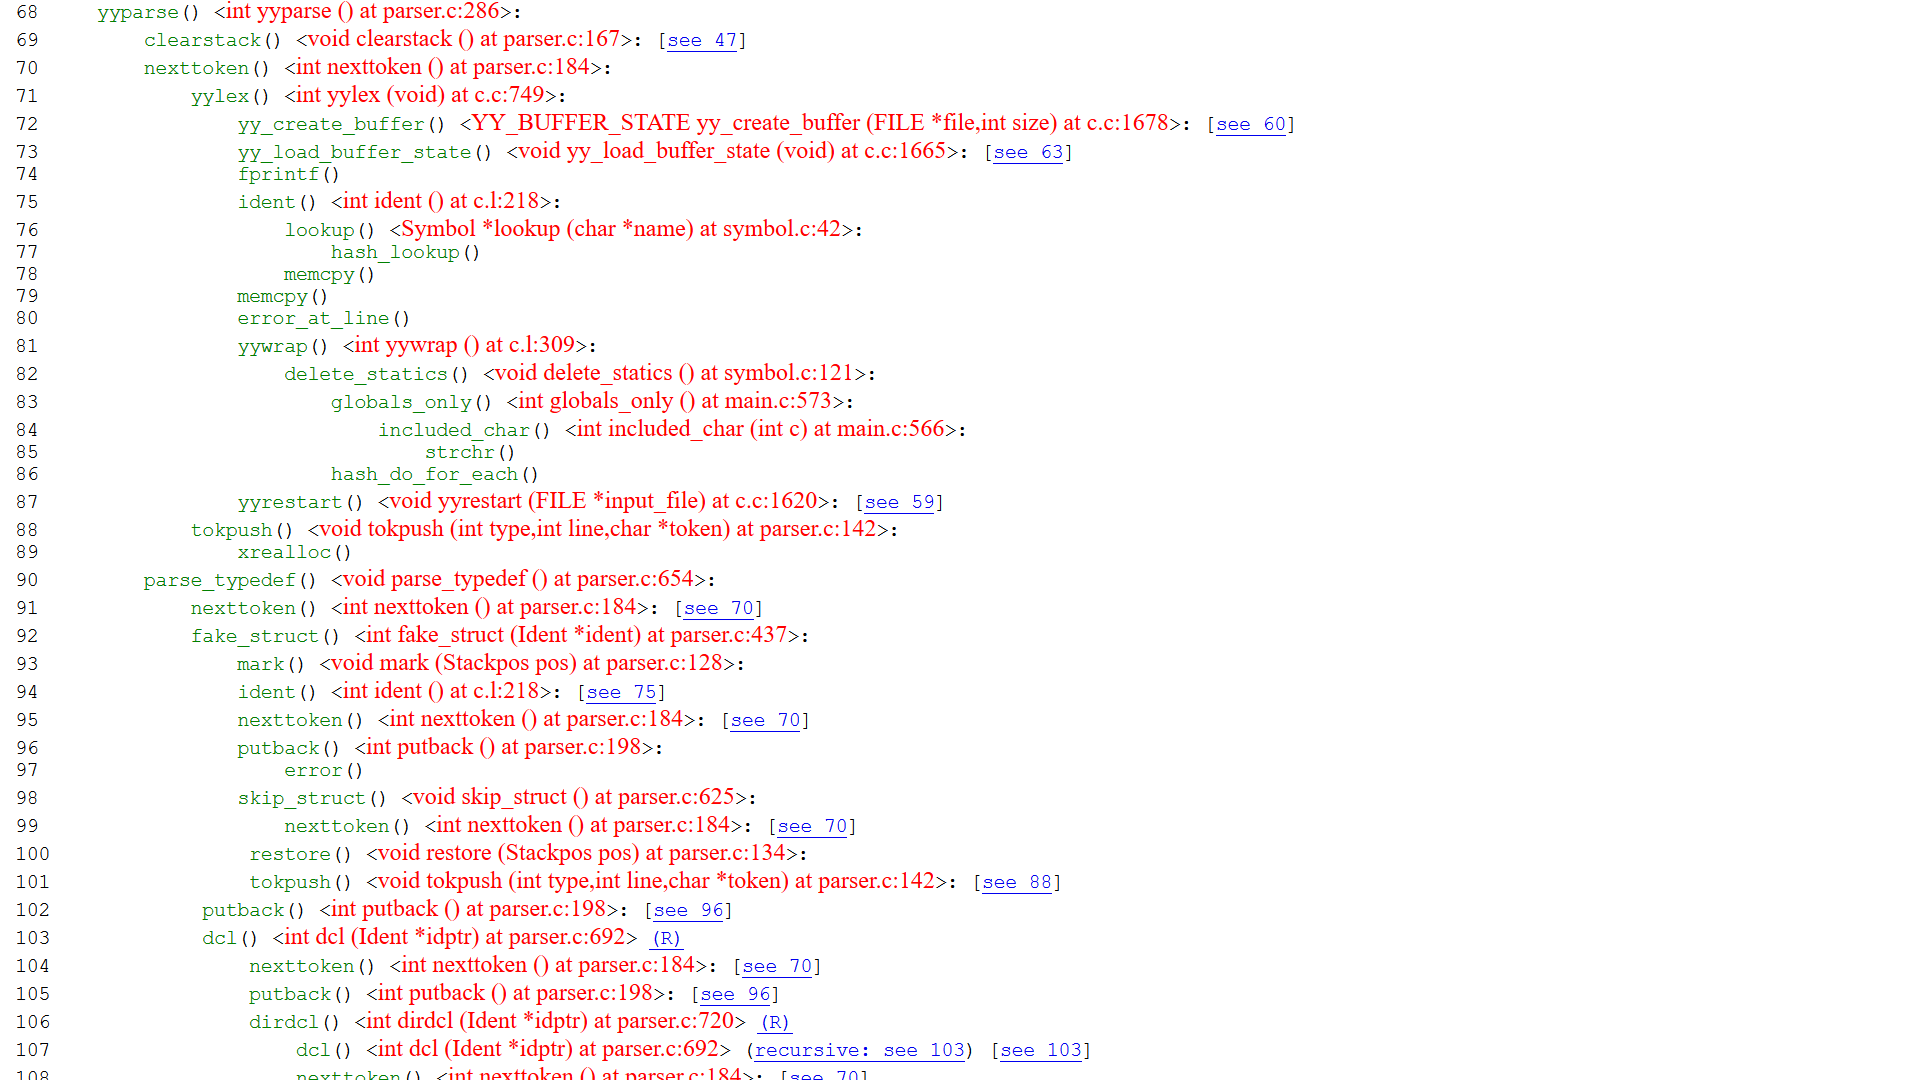
Oh, the output is in text format. Or rather html. Text with colors and links. Not quite what I had in mind. It generates a tree from the root, but if the same function occurs several times in the tree, it's only expanded the first time. The next time, we get these "see 70" links. That's inconvenient. I understand that the output tree might get ridiculously large otherwise. Also I see no easy way to find all callers of a function. Let's keep looking.
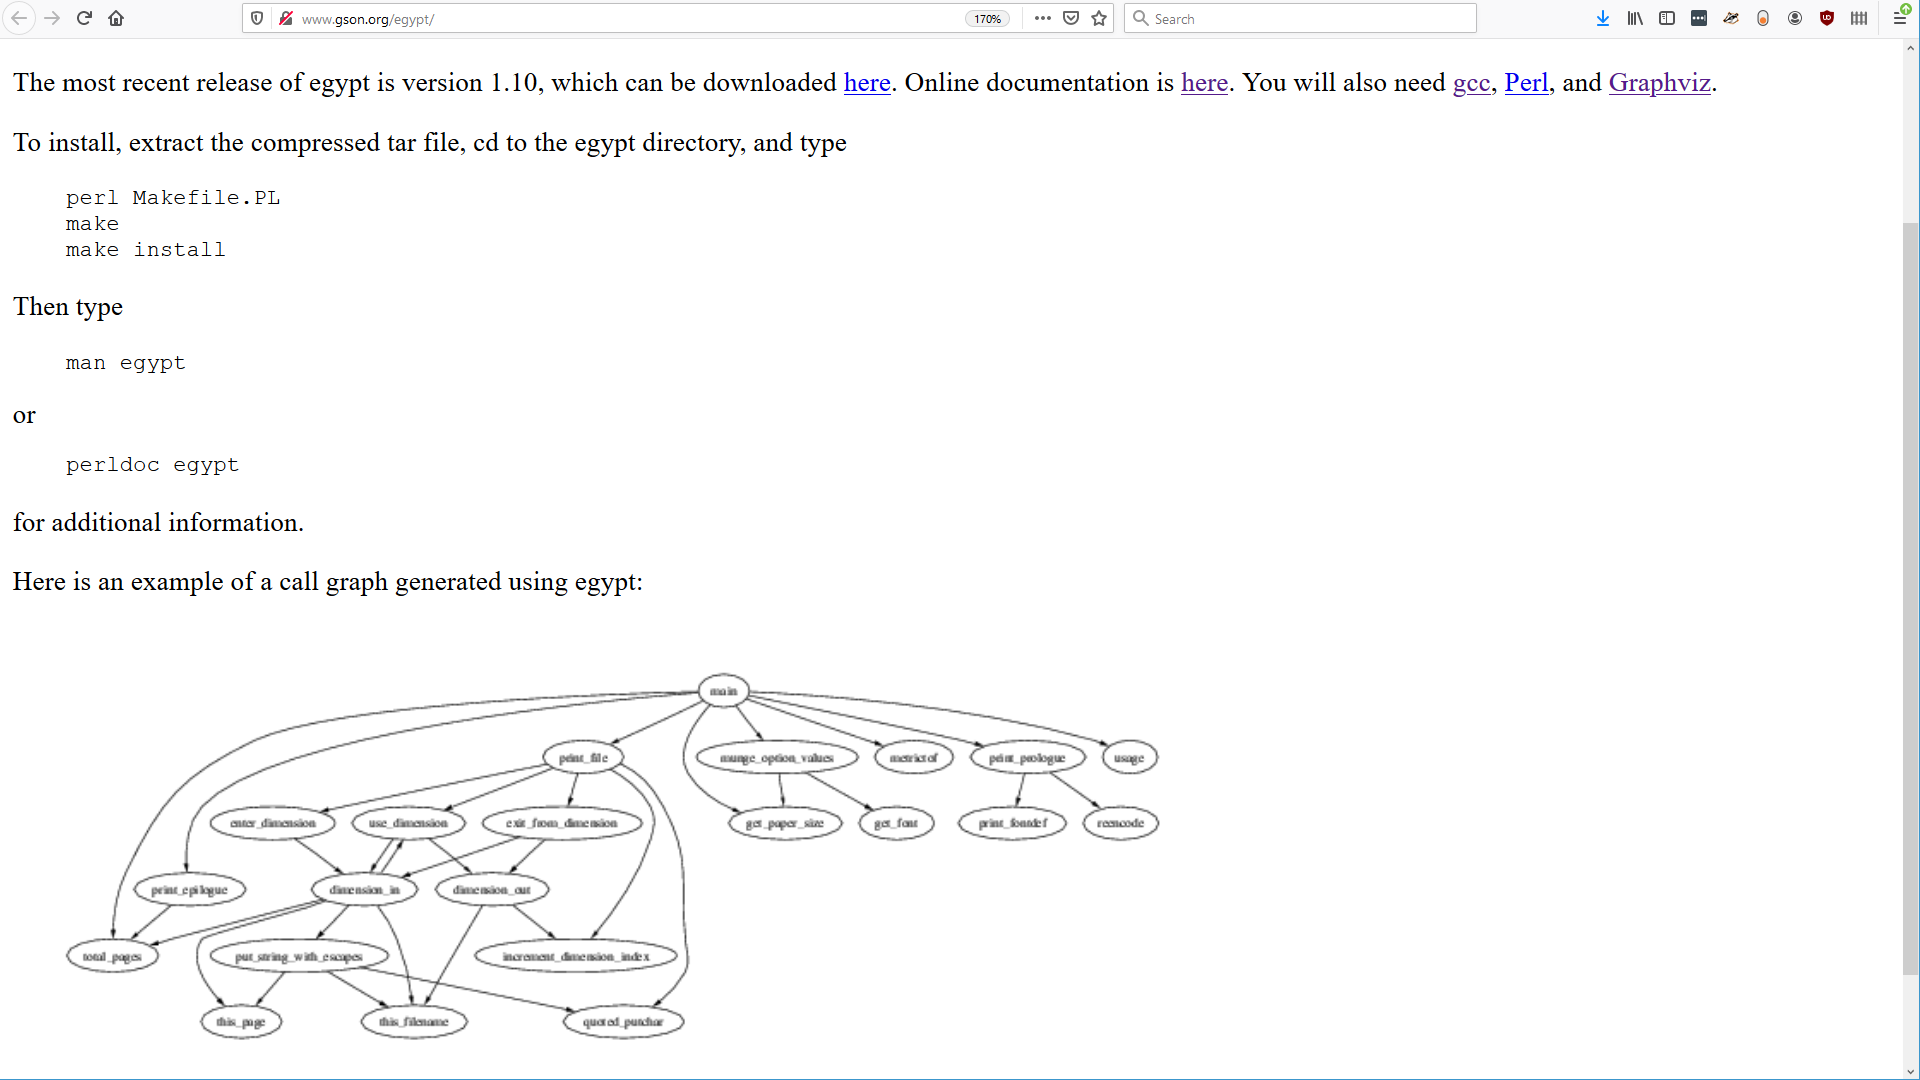
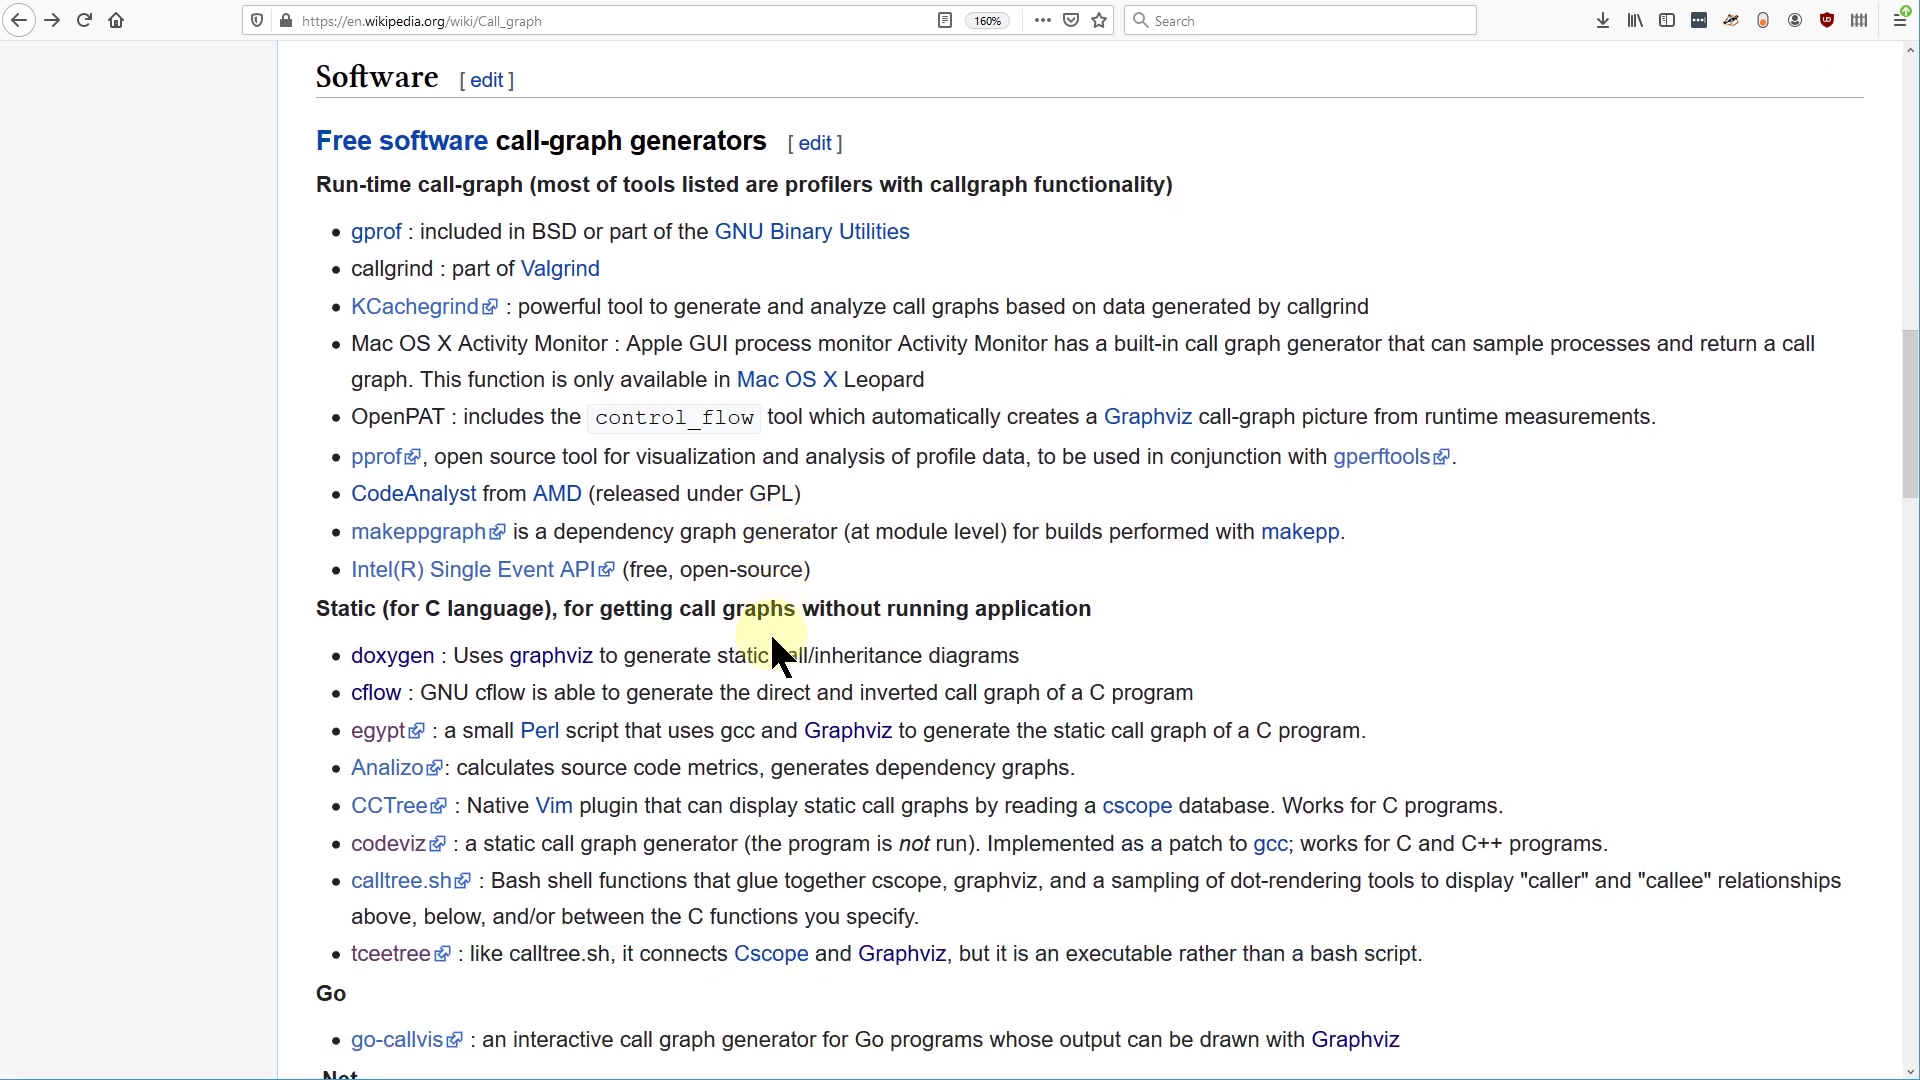
gcc, Perl, Graphviz and finally Egypt. This seems a bit hard to install. At least the output is graphical. Looks like it forms a layered graph, not a tree, so we can use it to find all callers of a function. But looks like it includes all functions. This is gonna be messy for a large program. Is there an option to... Let's read the docs.
"OPTIONS. Omit. Omit the given functions from the call graph. Multiple function names may be given separated by commas."Hm.
"Compile the program or source file you want to create a call graph for with gcc, adding the option "-fdump-rtl-expand" to CFLAGS"Hm.
"genfull - Use this to generate the full call graph for a project. This will be quite large and probably should be pared down with gengraph. Do not bother putting the output full.graph through dot yourself as it is unlikely to be rendered within a reasonable amount of time.Hm.
gengraph - This will generate a small subgraph and postscript file for a given set of functions."
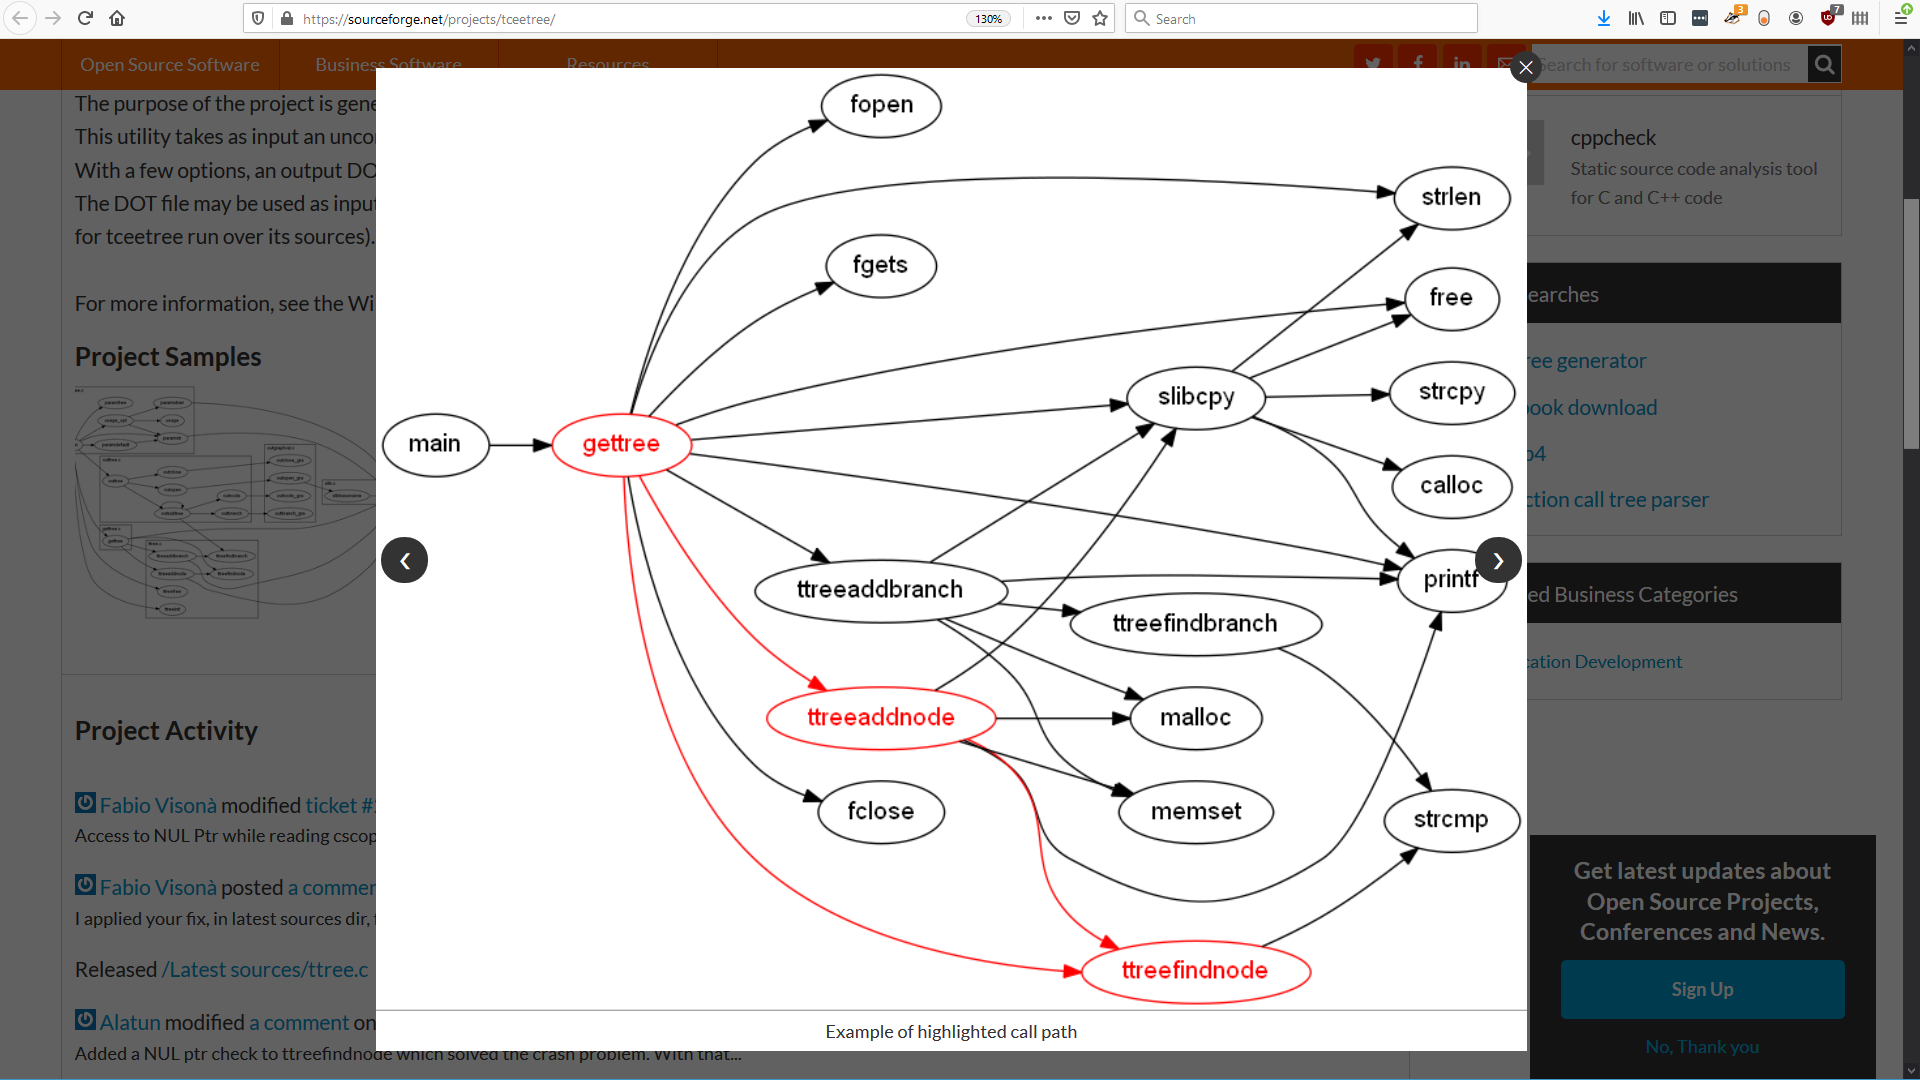
"This utility takes as input an uncompressed CScope (http://cscope.sourceforge.net/) output file. With a few options, an output DOT language file can be generated. The DOT file may be used as input for Graphviz (http://www.graphviz.org/) to make an image of the function call tree"Hm.
Looks similar to Egypt, in that it forms a layered graph. The options look a bit more powerful.
Ok, what if we leave the free software world and go commercial?
Visual Studio is a very big integrated development environment, so we might expect it to have a call graph. What do we have here? "View call hierarchy" - sounds promising, right?
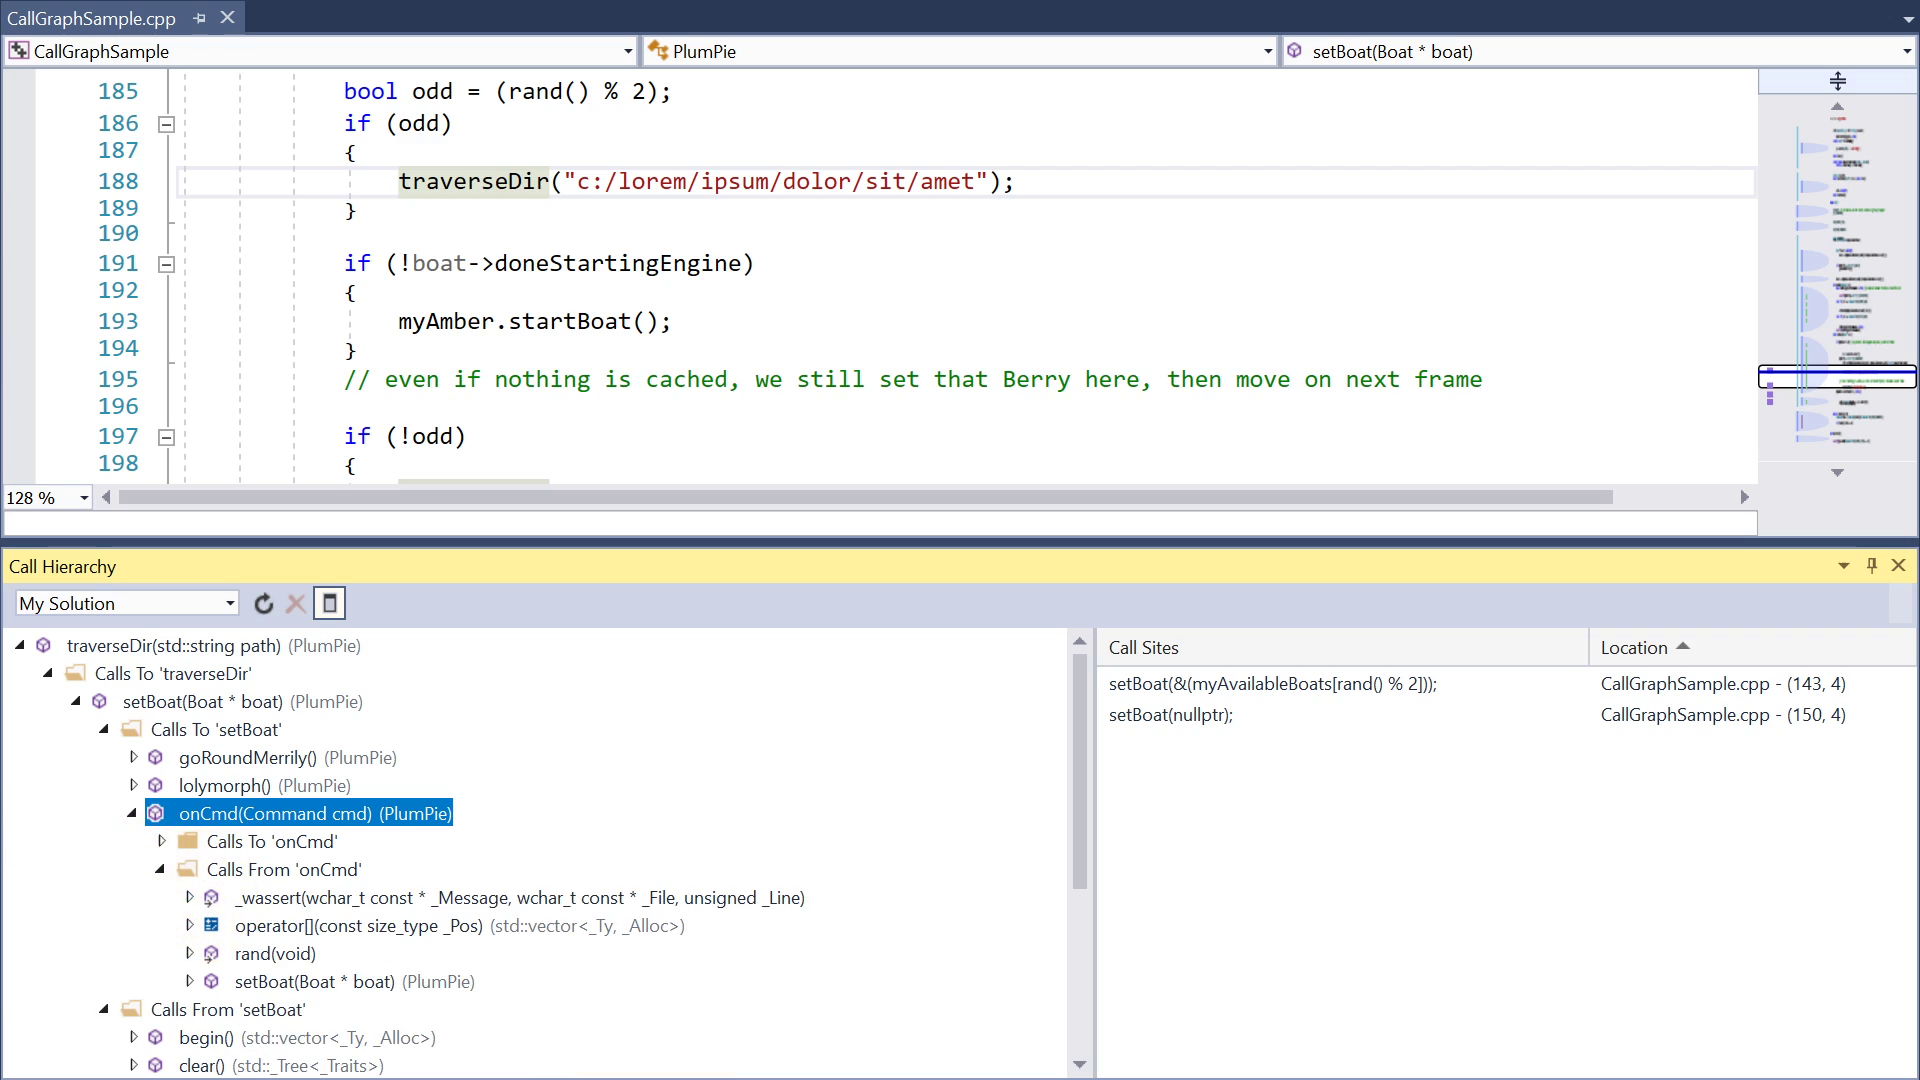
But why do I have to click so much? And why isn't it more visual? It's also often slow. It's fast now, because this is just a small example project, but in larger projects it can take seconds and interrupt my flow. And it often completely fails to find callers that I know exist. And it has bad support for virtual calls and first-class functions.
Finally, let's try SciTools Understand. They have a free trial.
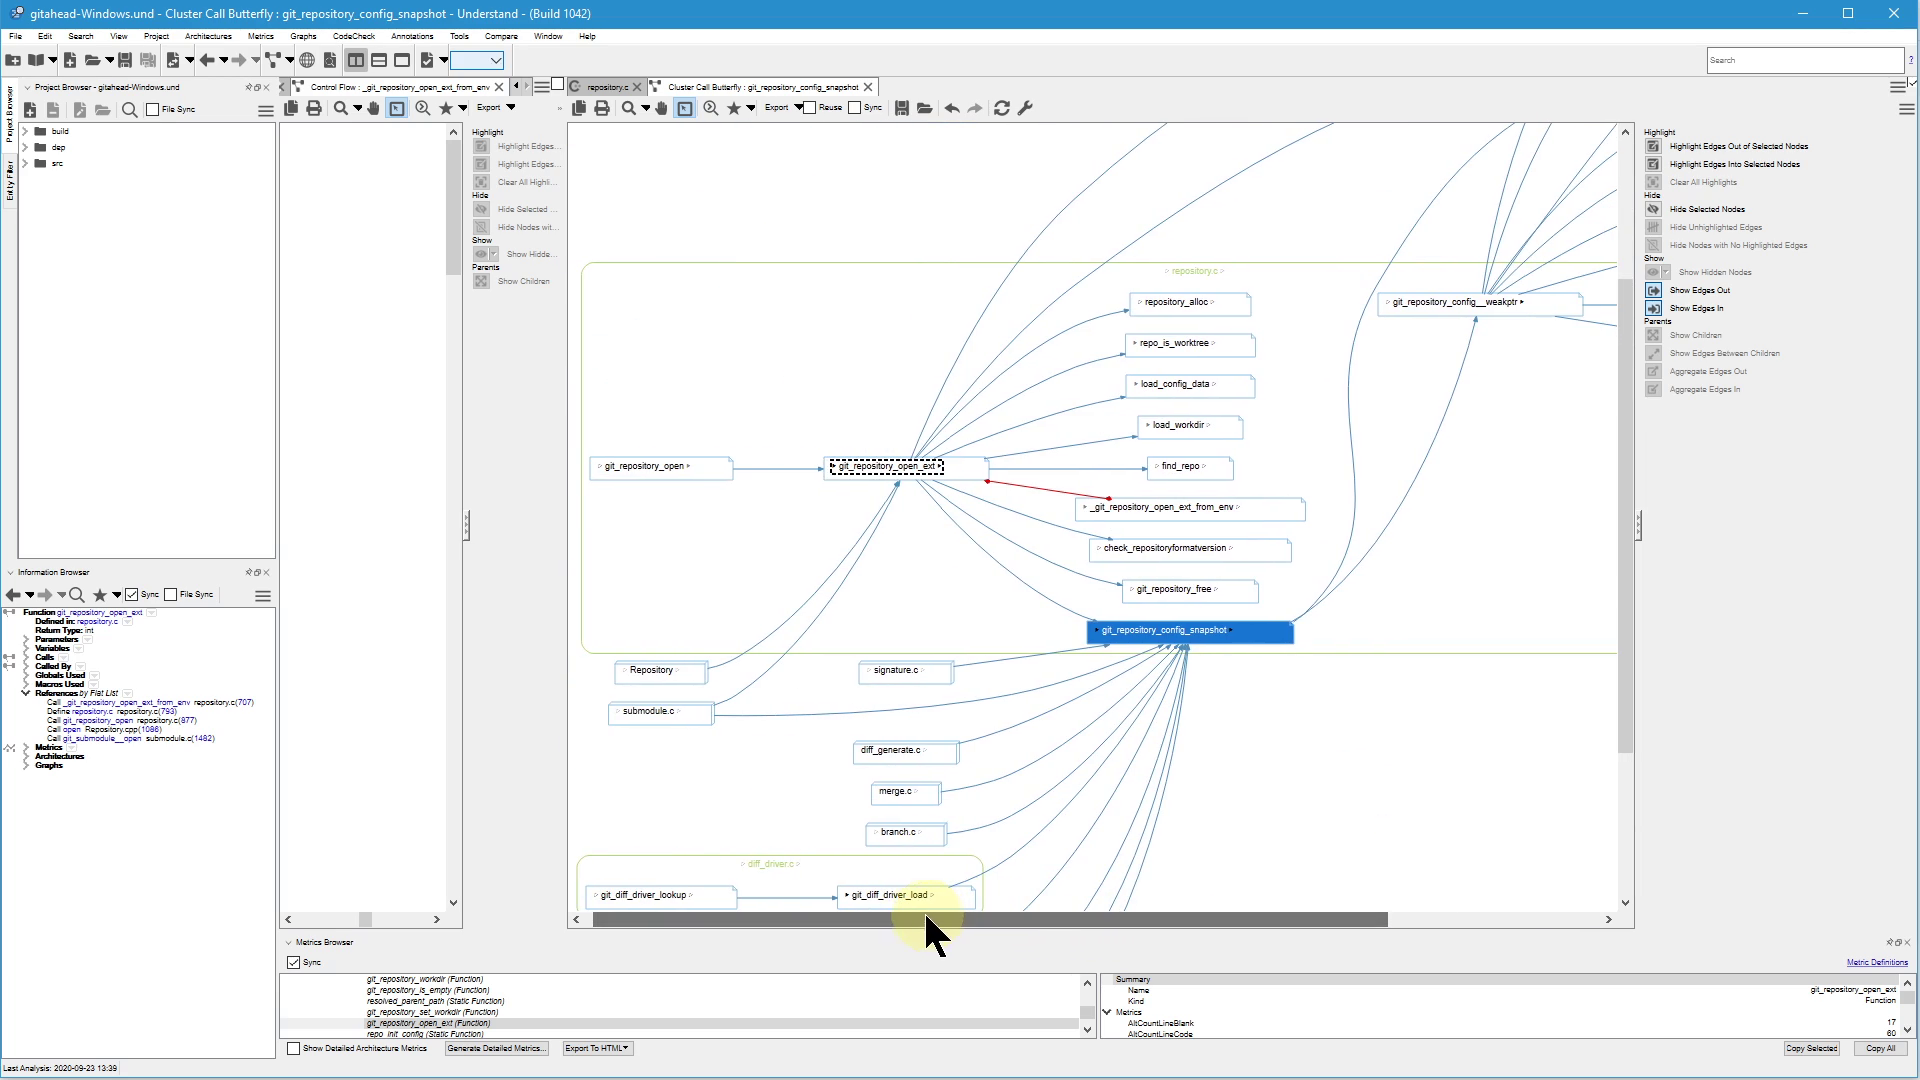
Okay, I can see why they recommend scheduling a consultation with someone on their team, together with the free trial. Because this tool is advanced and not exactly intuitive. It's probably the best of the bunch we've looked at. But there has to be a way to get these benefits in a more usable design. Despite a million options there are still some, in my opinion, pretty obvious things this tool can't do, and it seems constrained by this underlying assumption that you're manually creating a diagram as an artifact for printing etc.
Ok, we looked at a bunch of tools, mostly for C & C++. I suppose they successfully do what they were designed to do, but none of them were designed to do what I want.
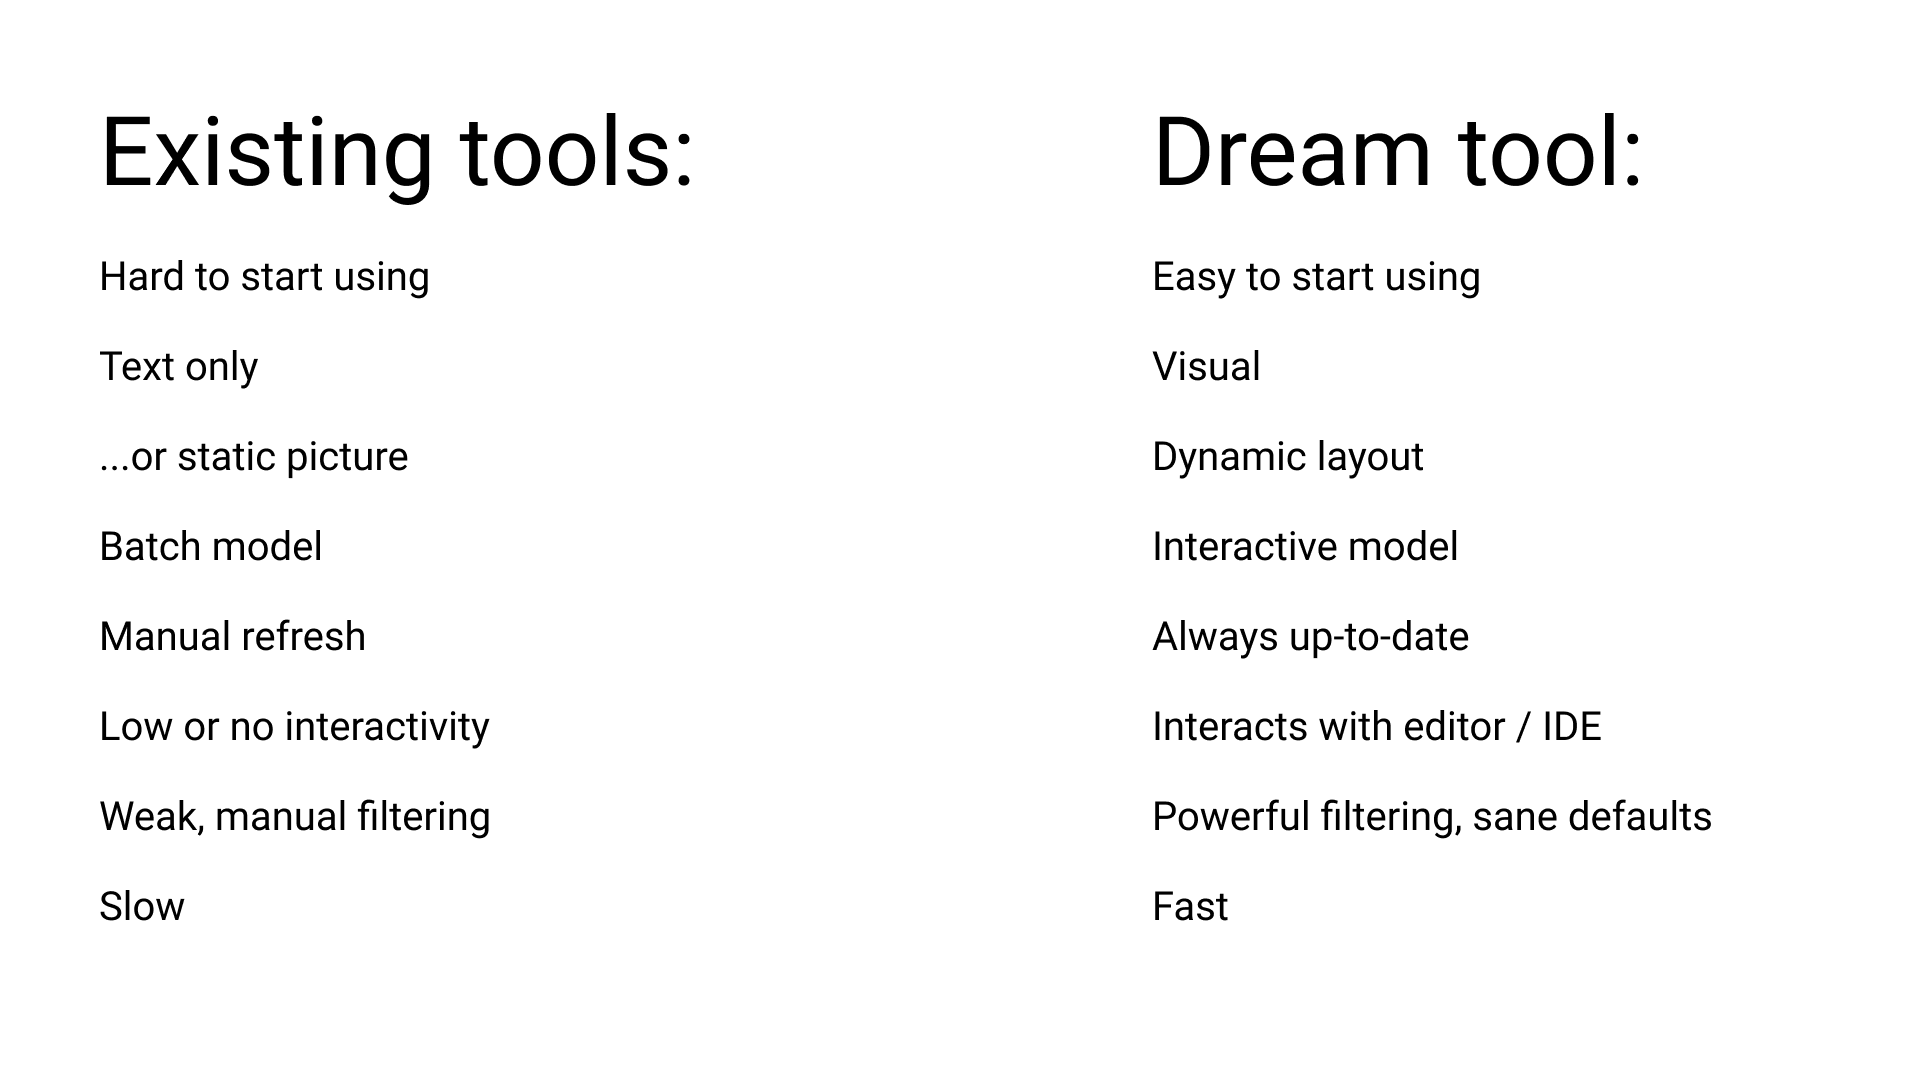
Most are unnecessarily hard to start using. Ideally they should be built in. Of course, any standalone tool or plugin needs to be downloaded and installed, that's unavoidable, but the amount of extra friction should be zero.
Some of the tools just output text, which might be an advantage if you want it machine-readable, but it doesn't take good advantage of the visual hardware in our head.
And most tools that do show the graph visually, just output a static picture file. With the exception of SciTools Understand. But even there, all objects are still layed out with fixed positions and sizes as if on paper. My dream tool has a way more dynamic layout - more on that later.
Most tools use the batch processing model. Our code goes in one end, and a finished graph comes out the other end, period. This has some disadvantages, for example, changes to the graph can't be animated.
Another disadvantage is that when we make a change to the code, the graph is not automatically refreshed. In my dream tool, it's always up-to-date.
If we click on a function in a static picture file, nothing happens of course. But we deserve a live connection that goes both ways between graph and text editor.
Most tools by default put the whole program in the picture, which means it's inevitably messy. To solve this, many tools offer a command-line option to filter the output to only show a part of the graph. Either by a blocklist of functions to NOT show, or by an allow-list of functions to show. But wait a minute, if we need to give a list of functions to the tool, we need to already understand the code well enough to decide what that list should be. Kind of a catch-22. It's better if a tool can help us interactively discover which functions we care about. This also goes for other options. Even in SciTools, before it shows us anything, we have to make a blind choice about what kind of graph we want to see. Then we get to see it. This is completely backwards.
And of course, a tool that makes us wait for longer than a few milliseconds is just not pleasant to work with.
But I'm not here just to complain. In general, I think it's quite easy for us to criticize and point out flaws in something, and doing so can make one feel so smart and superior. But the real challenge isn't to criticize but to come up with the better alternatives. I'm making these videos to try to be constructive.
So now let me show my take on what a good call graph tool should be like. First of all, since we can't handle seeing the whole graph for a large program all at once, the tool has to reduce it somehow. How?
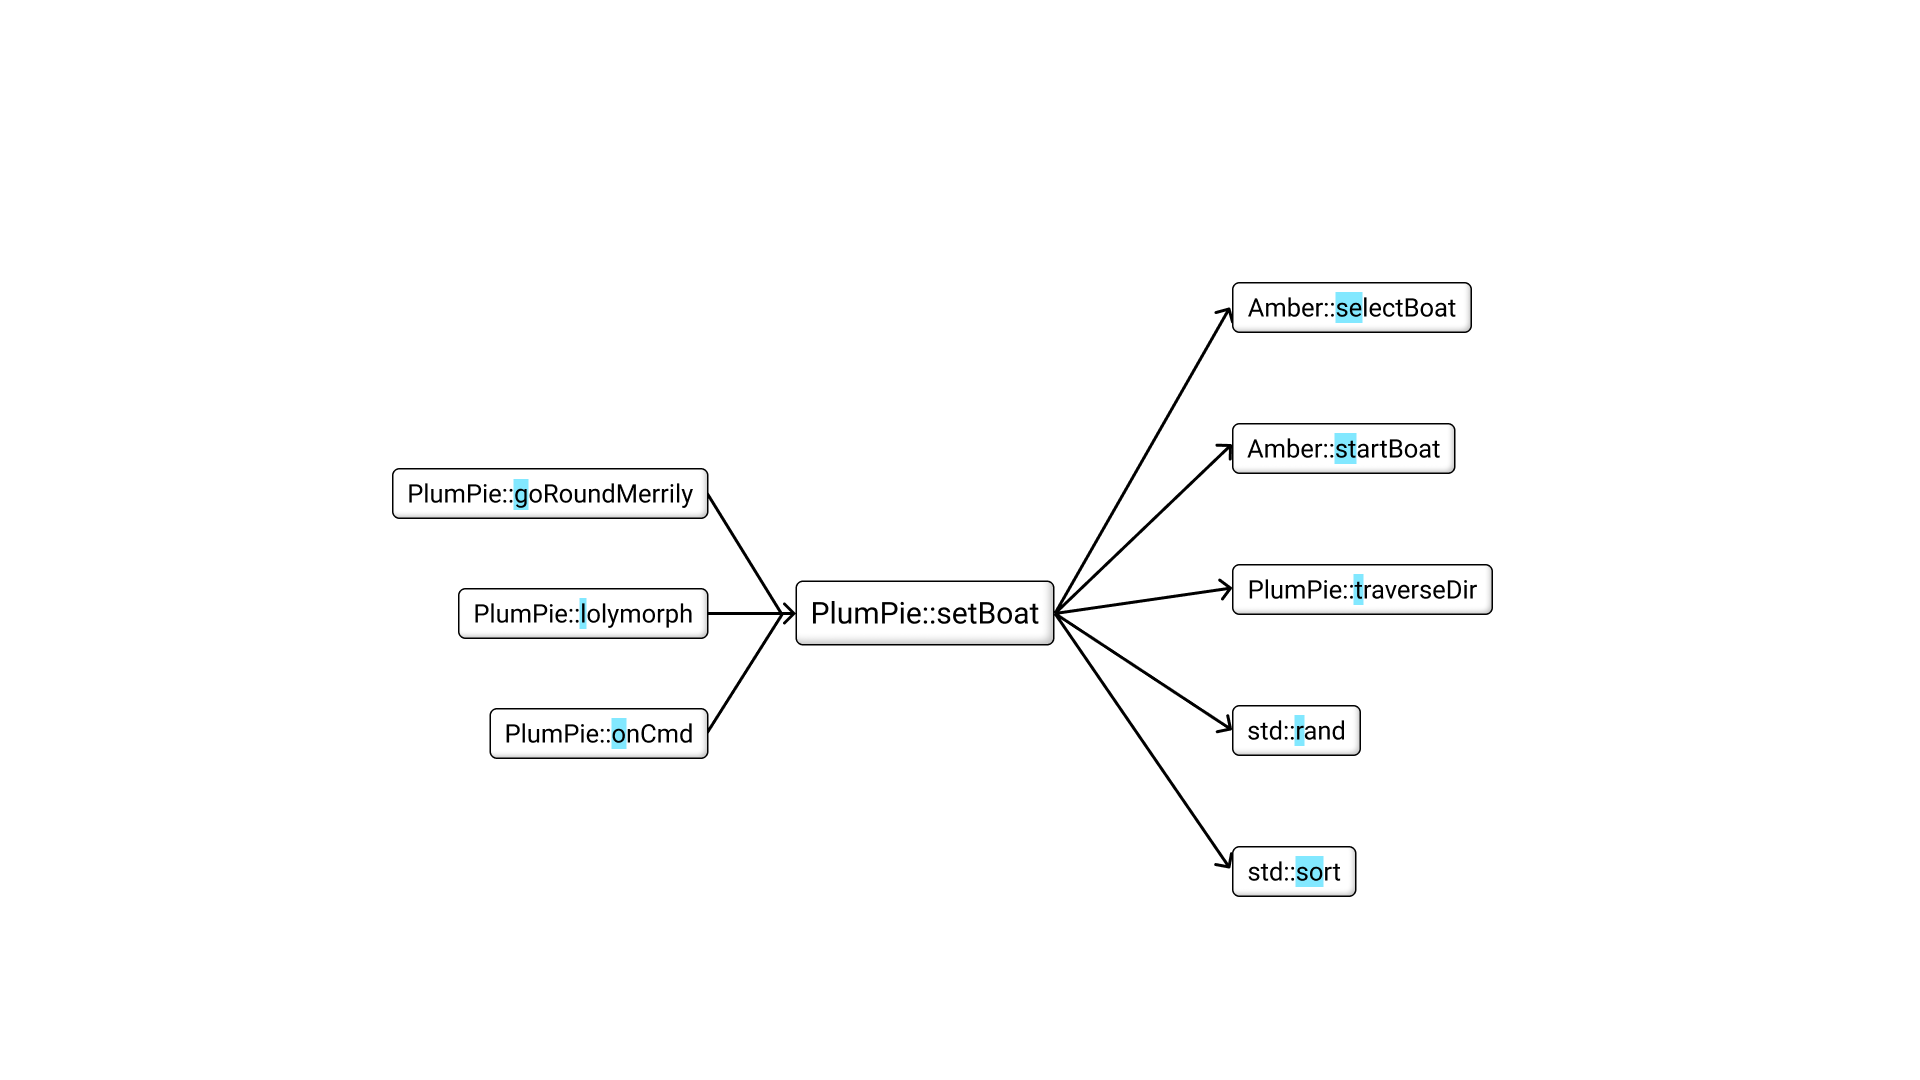
The most obvious simplification I can think of is a so-called "butterfly graph".
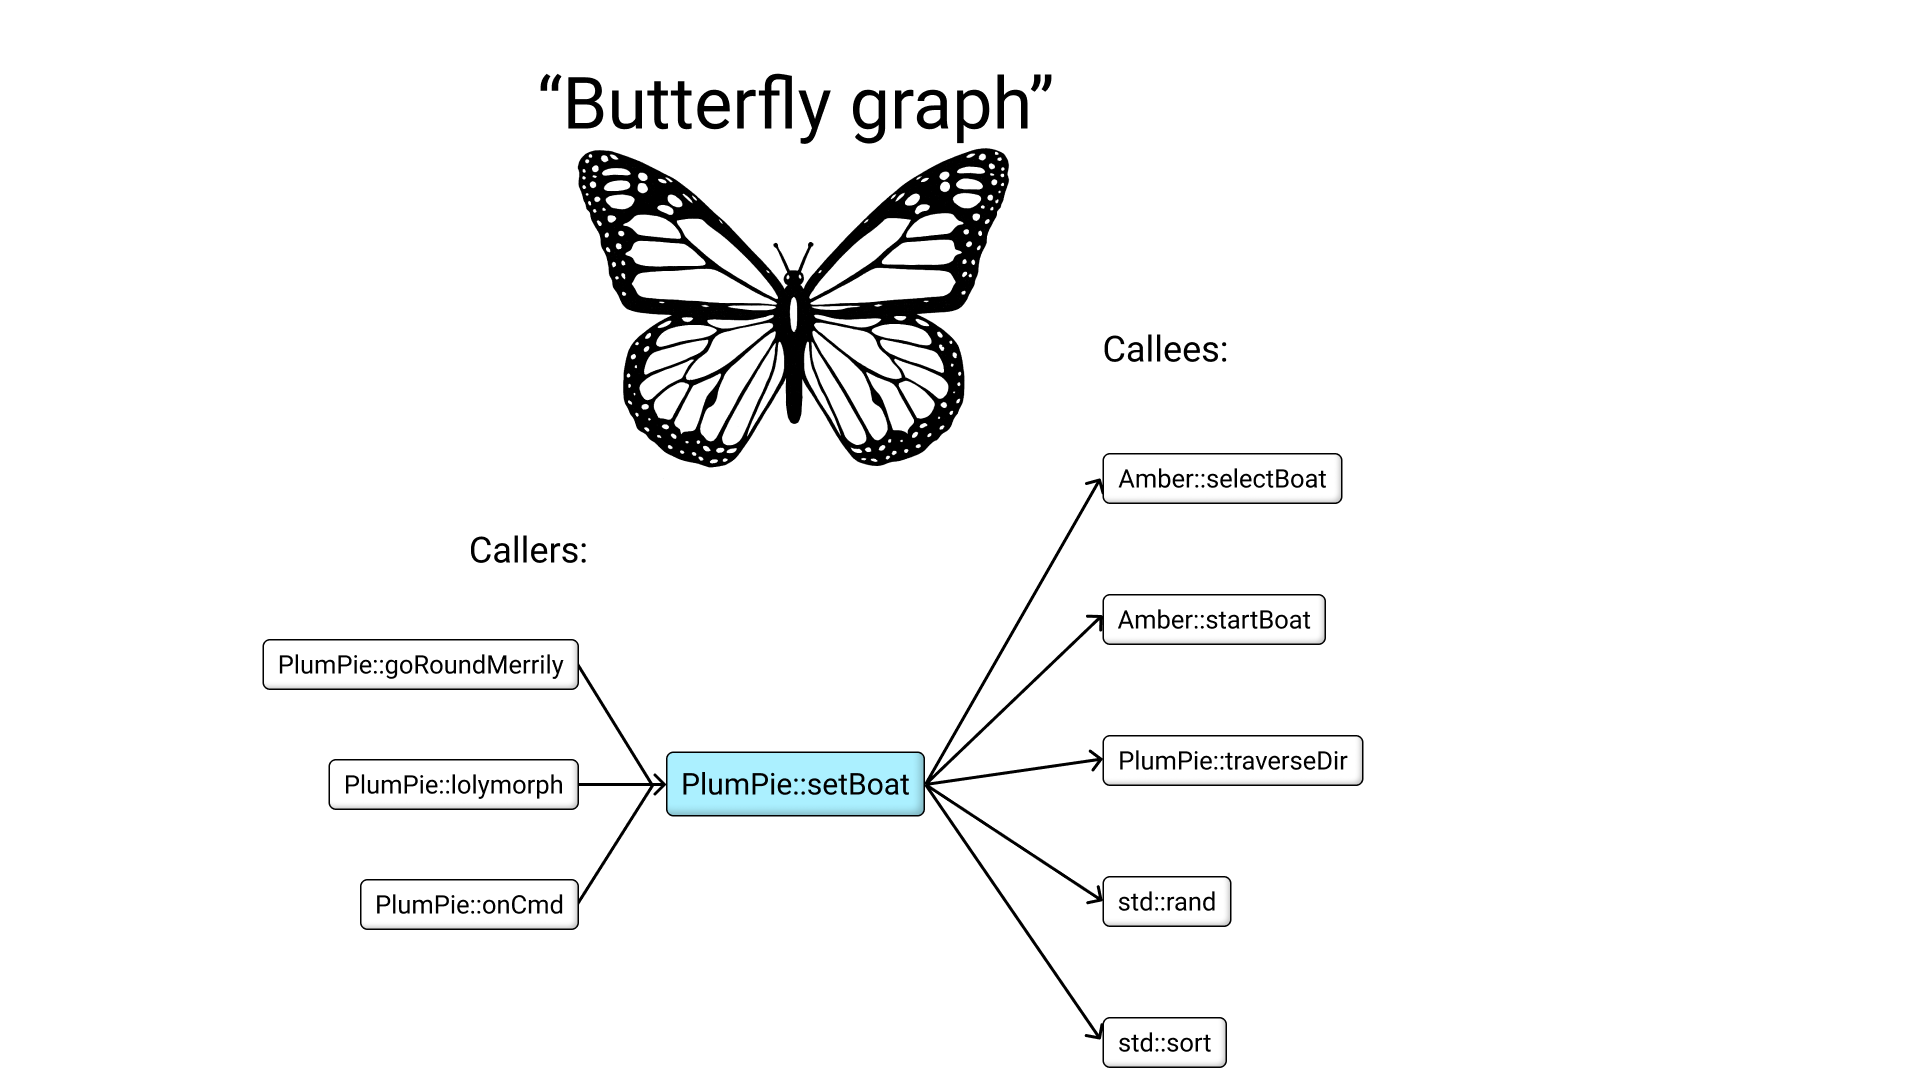
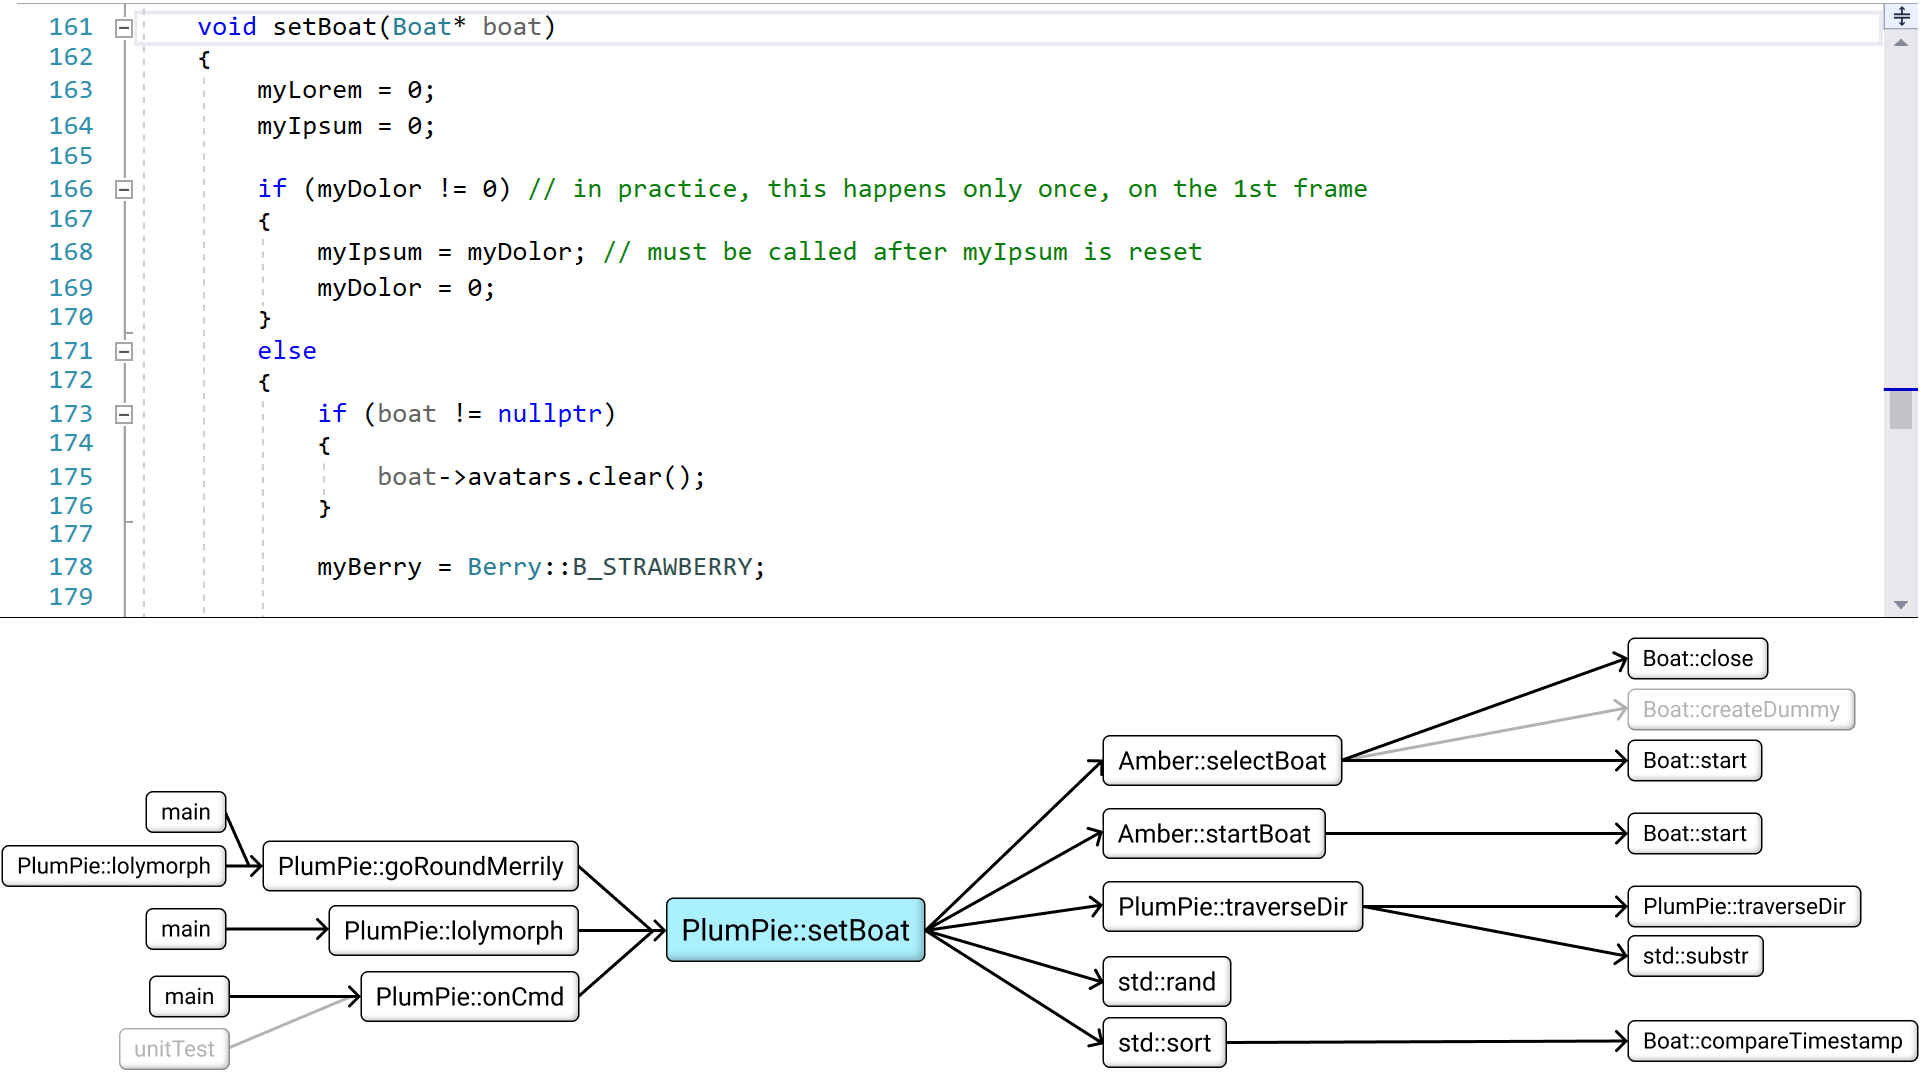
In the middle, you have a "current function", that is the function where your focus is right now. In this example, the current function is PlumPie::setBoat. On the right side, list all functions that are called by setBoat, aka the callees. On the left side, list all functions that calls setBoat, aka the callers. Then we can do the same thing one more step away.
This way, even if the program is arbitrarily large, the amount of stuff we see at the same time is bounded. When I say "one more step away", I mean that we show the callers' callers, but not the callers' callees. In other words, if this was a family tree, it would mean displaying grandparents, but not siblings. Why? Because otherwise it would look too messy. But the design could hint that some functions are hidden from view, by showing arrows that fade into transparency.
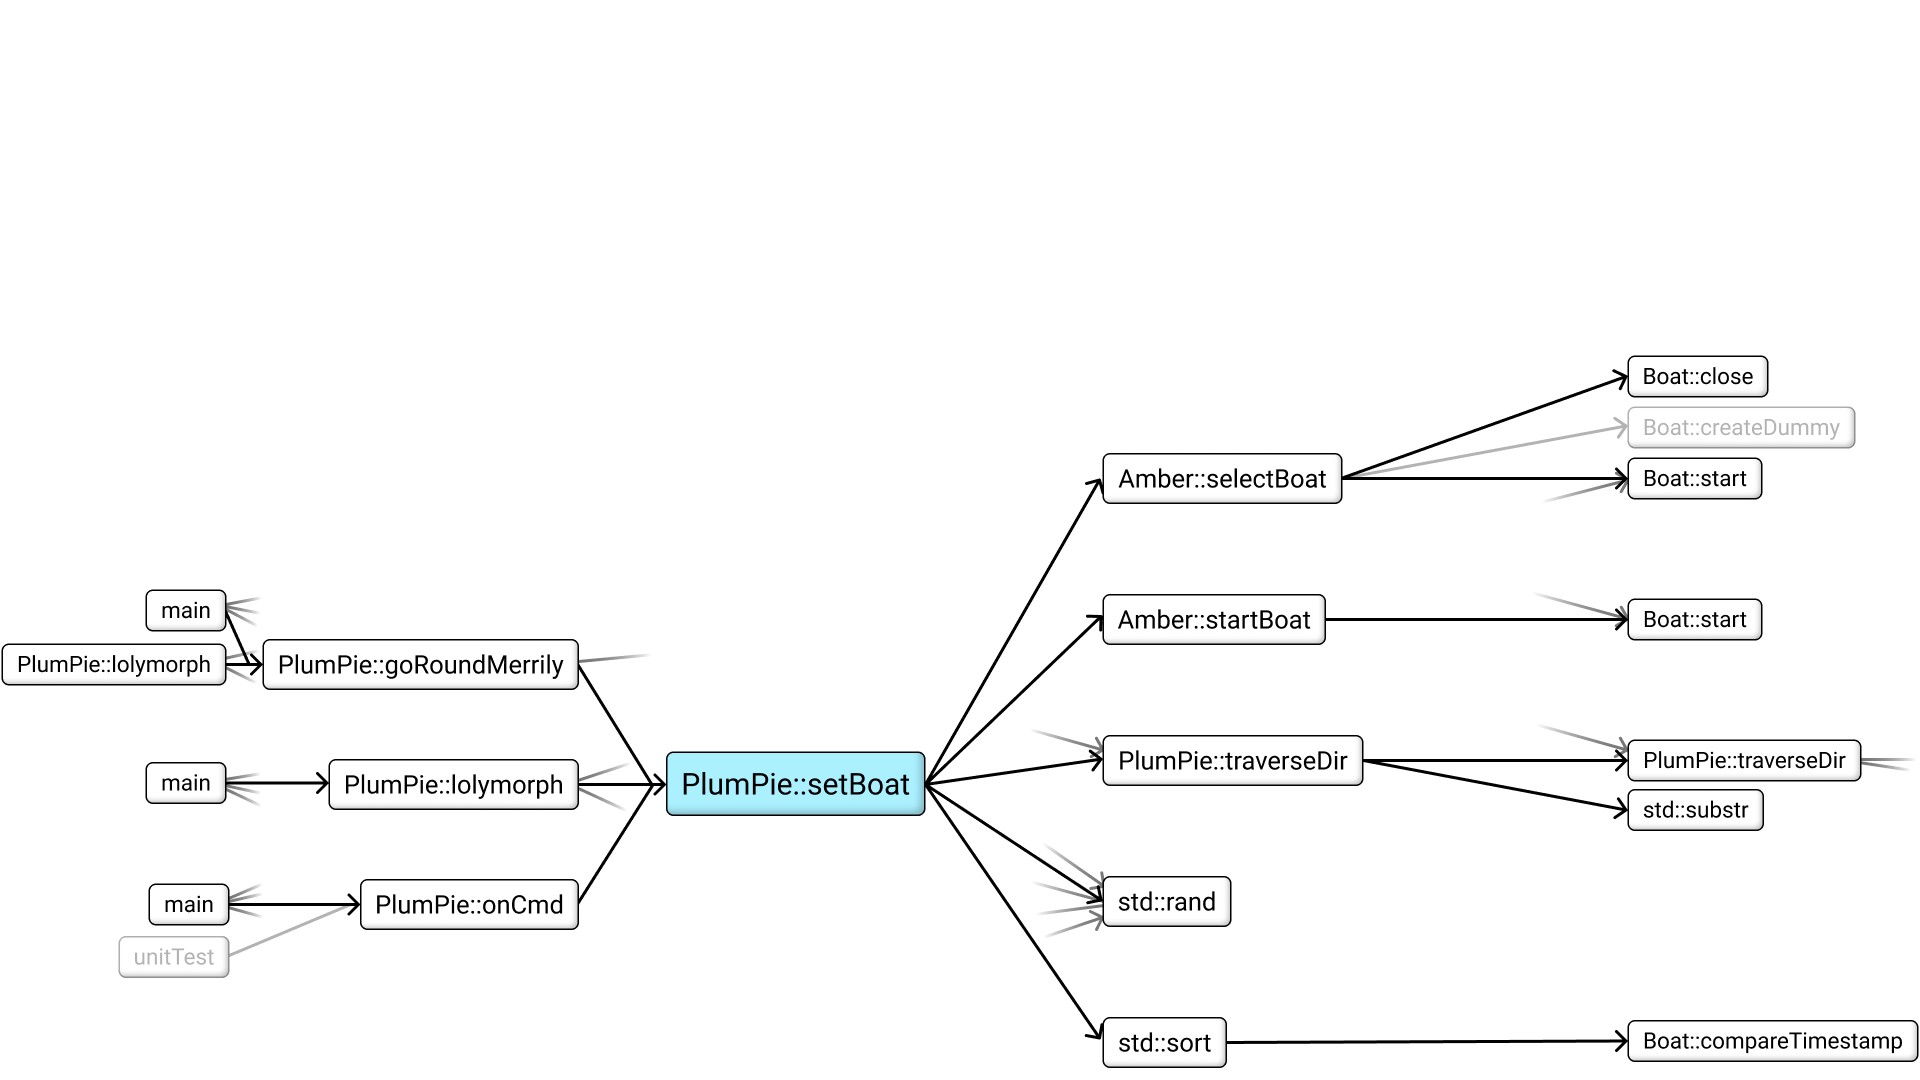
I think this will serve as a constant gentle reminder that you're not seeing a complete picture. To save myself some time I didn't add these fading arrows to the next picture, but imagine that they stay throughout the rest of this demo. Now that we have this view, how do we integrate it with the rest of your development environment? Just like in a previous video, we could split the screen and have this call graph beside your usual text editor.
Or we could toggle between them - more on that later. This should not just be a static picture, but an interactive thing, so you can click on any caller or callee, and they become the new "current function" in the middle. This click could also automatically navigate to that function in your text editor, too.
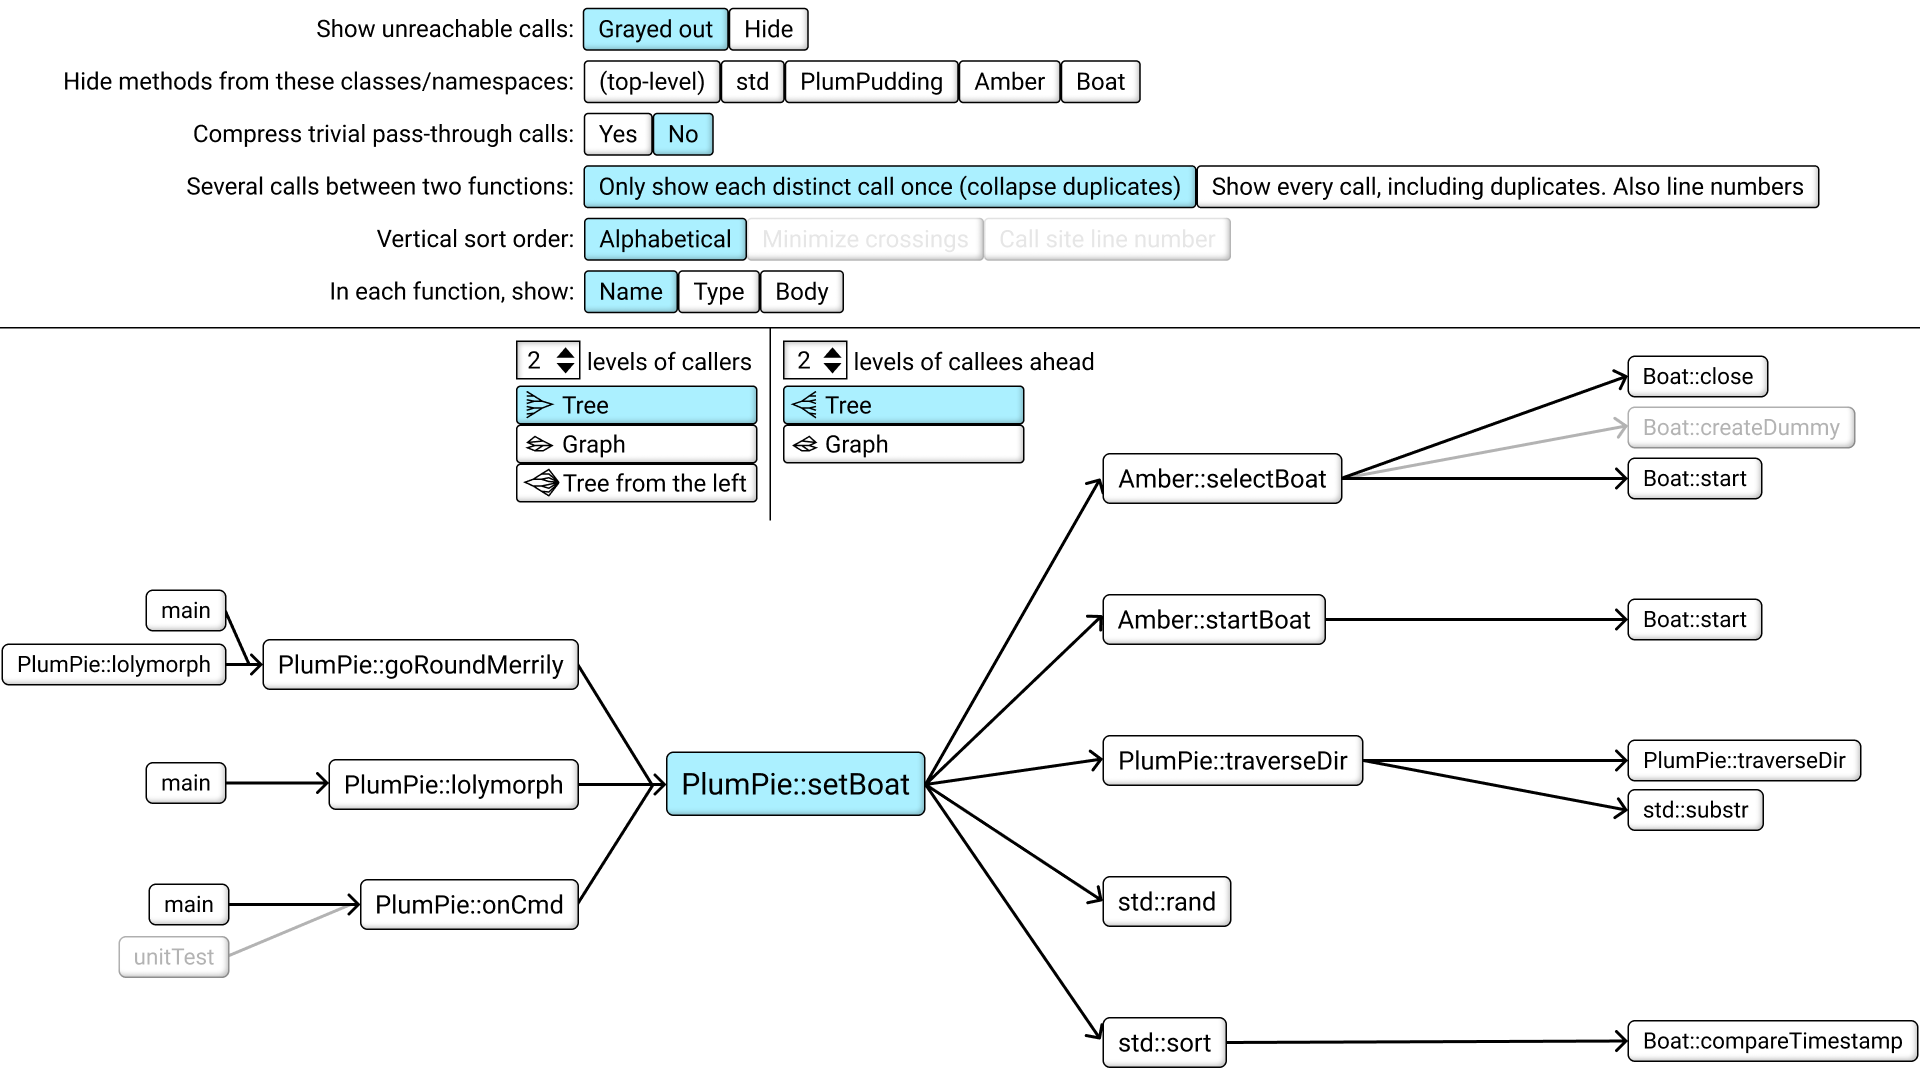
And the other way around, so if you move the caret in the text editor to a new function, the call graph also updates. So the text editor and the call graph always stay in sync. If this becomes annoying to use, we could add an option to turn off the automatic syncing in either direction and only sync manually. Actually, I think the user needs a bunch of options, so here is the same graph but with an options panel added on top.
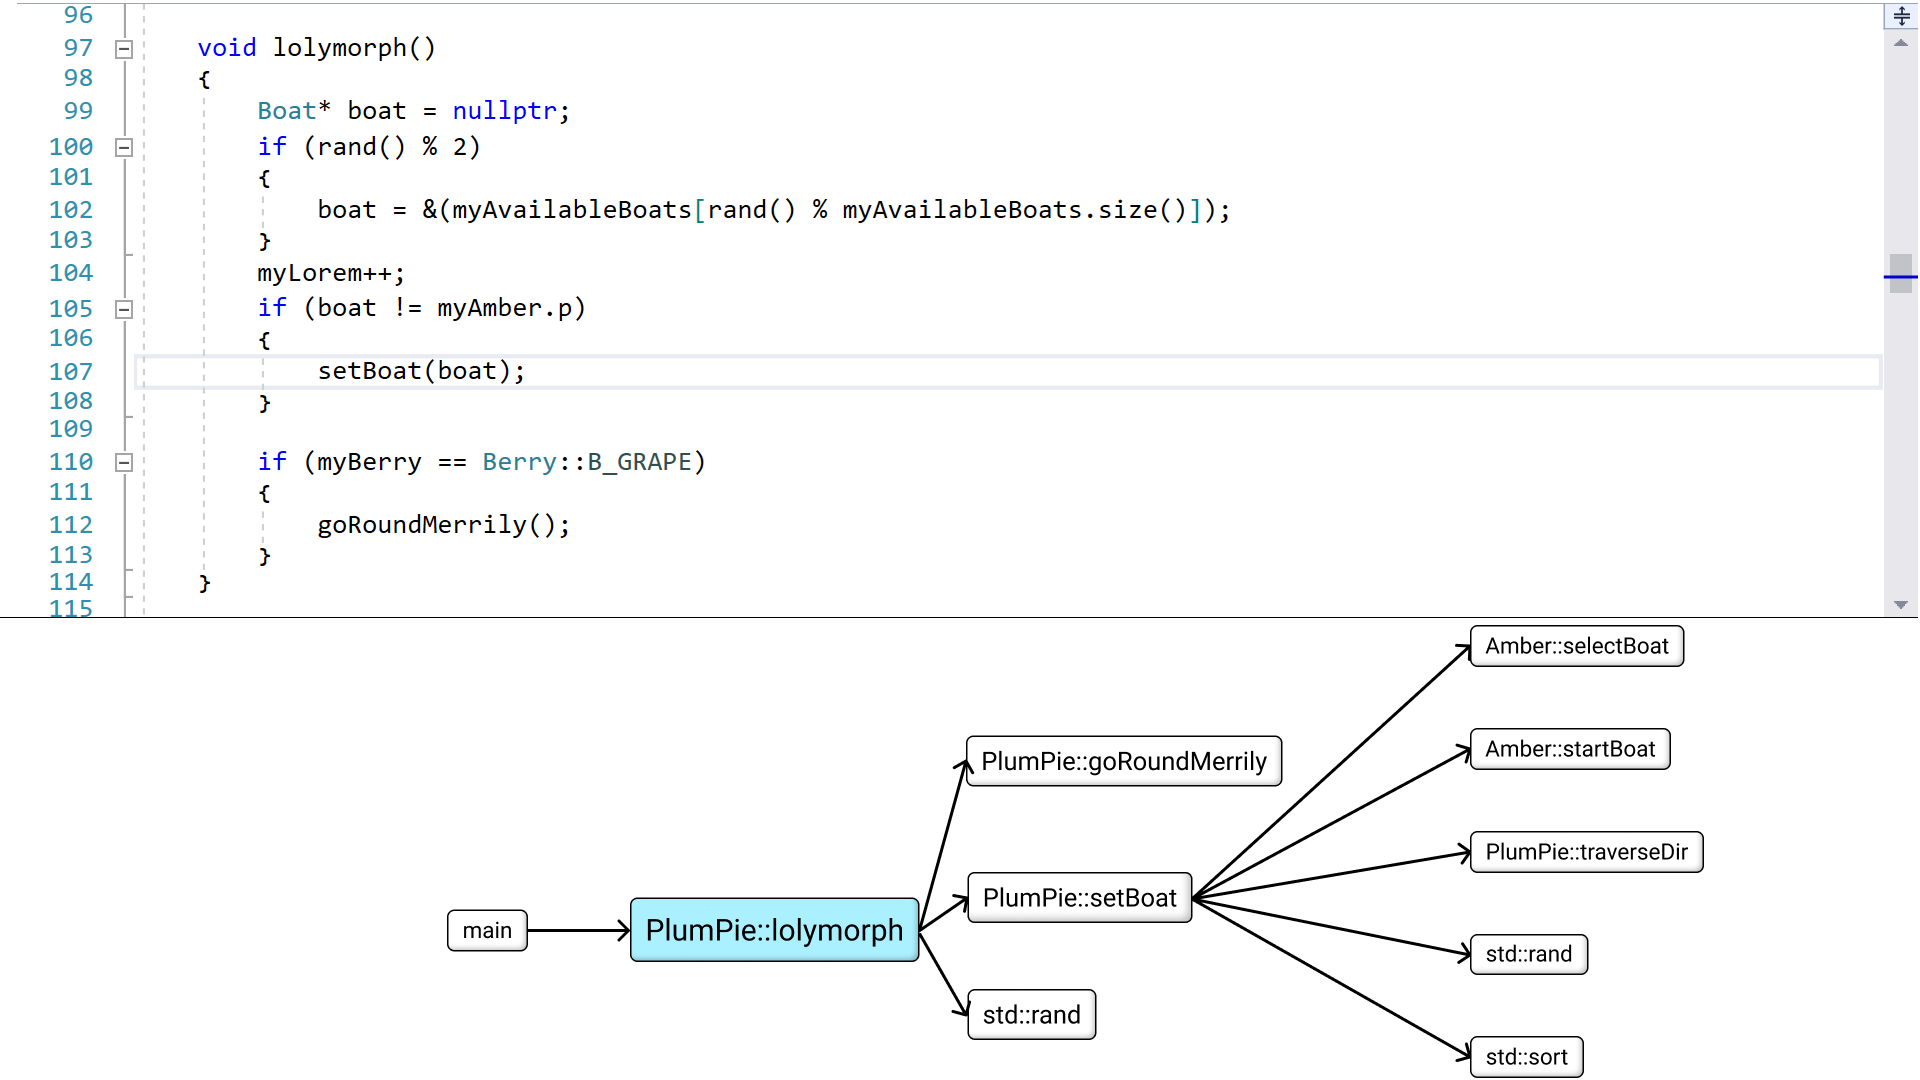
I said before we should show callers and callees 2 steps out from the current function. I think 2 steps is a reasonable default, but then the user should be able to customize it. Changing the number of callees would look something like this.
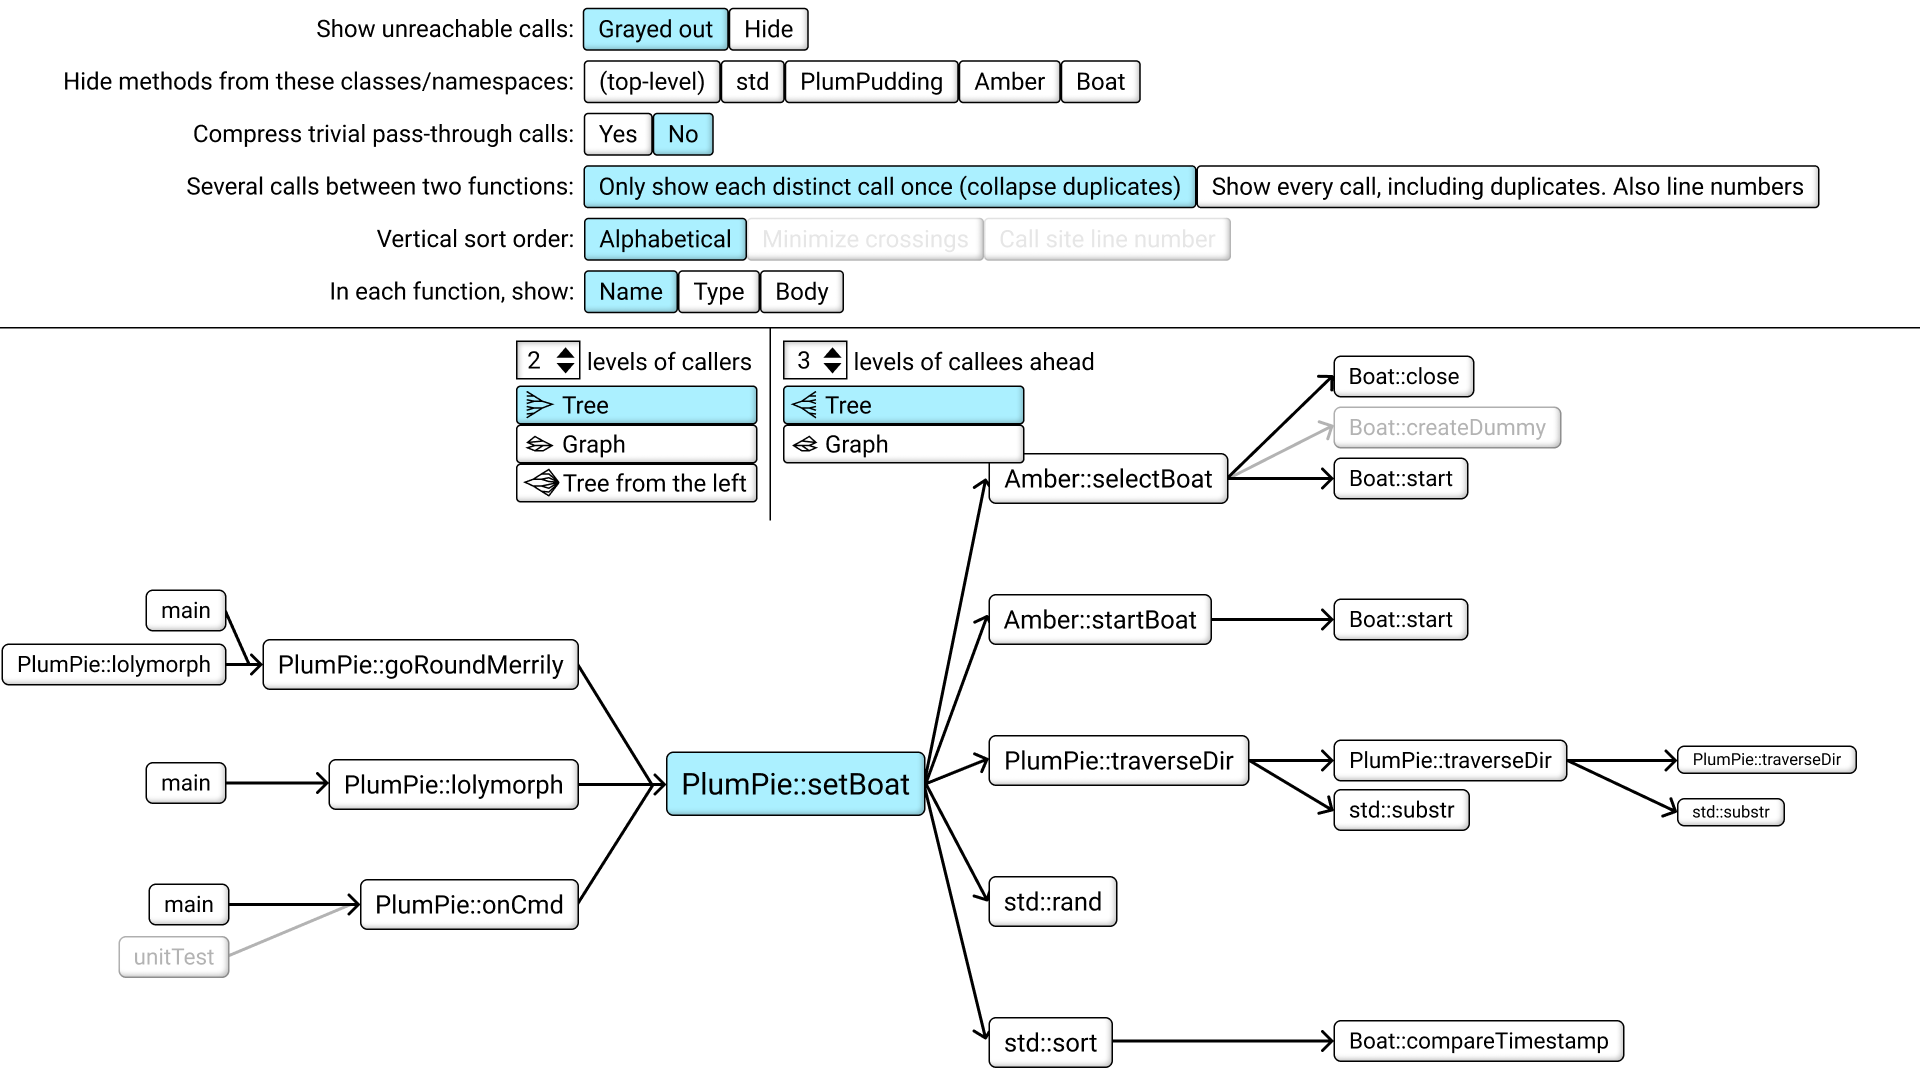
The more we show, the harder it will be to fit everything on screen, so to help with that I used smaller and smaller font size the further out we go, kinda like a photo with a fisheye lens.
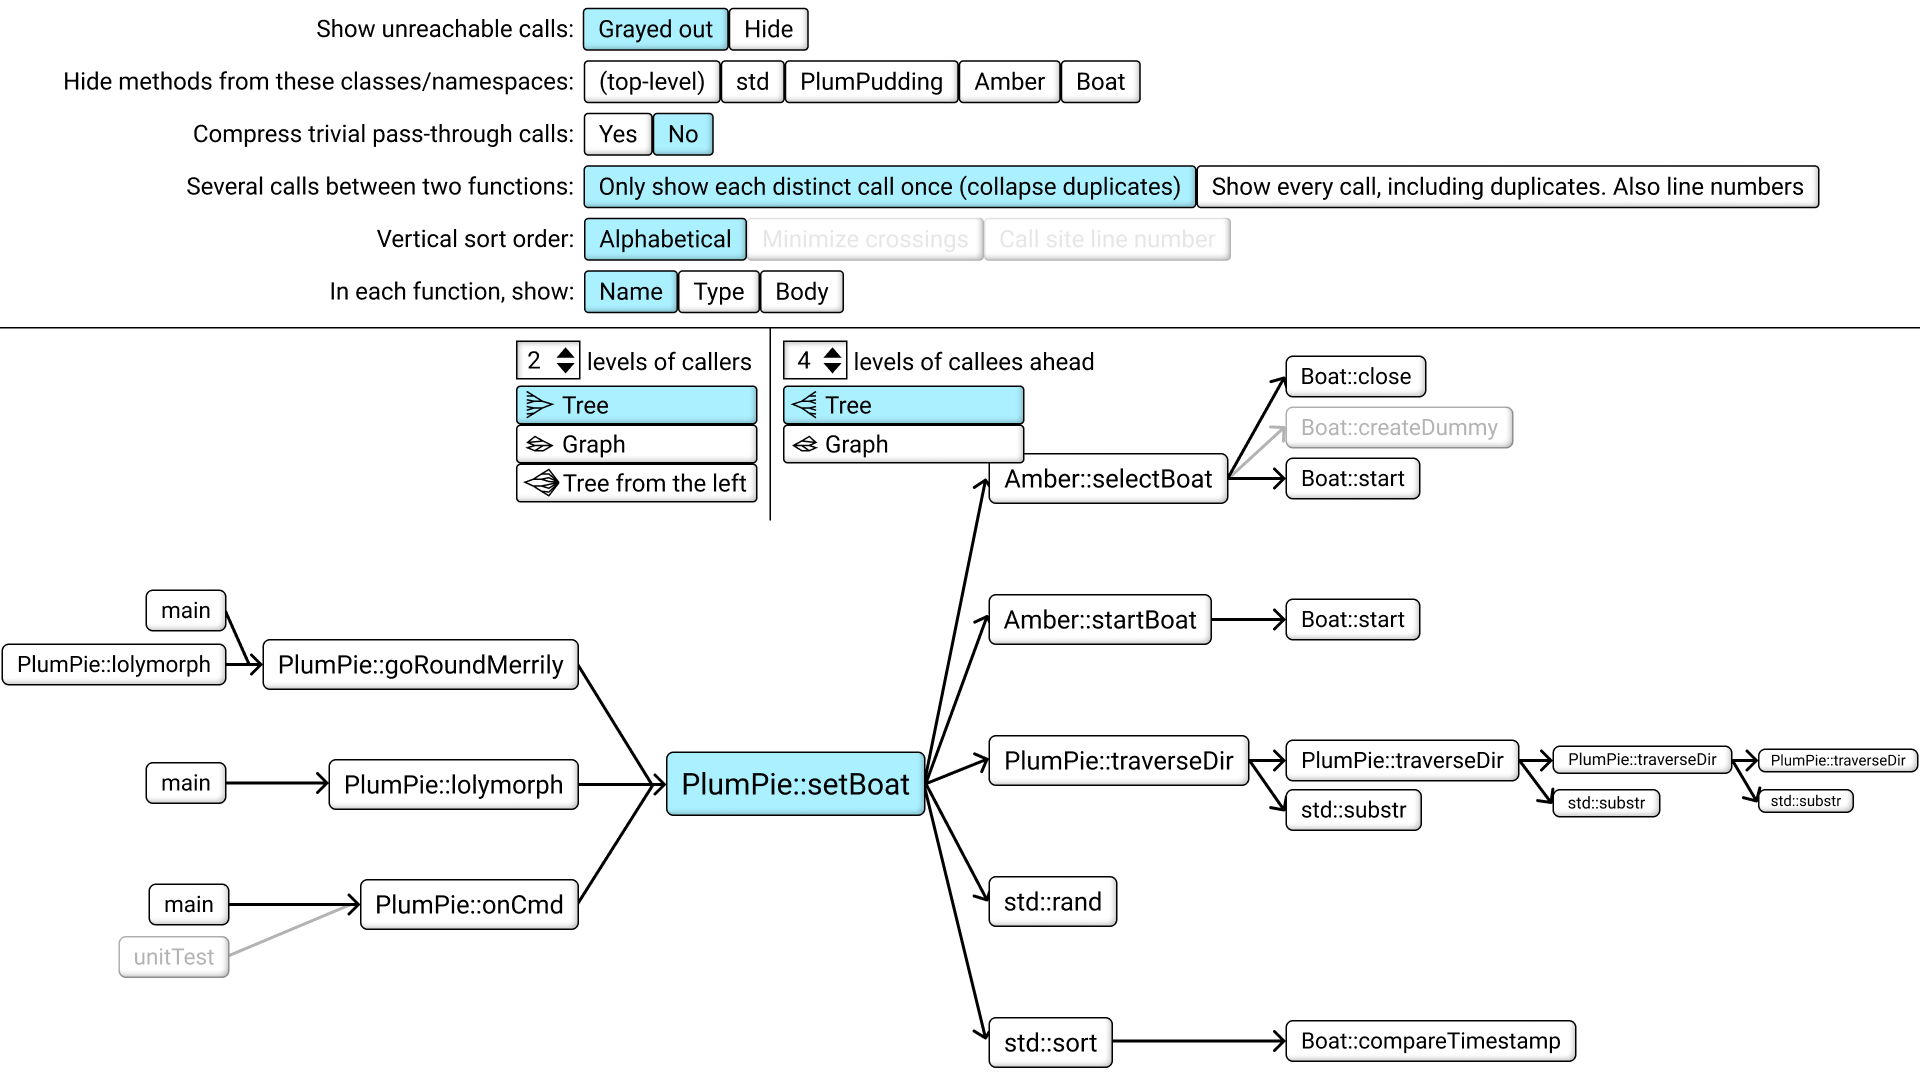
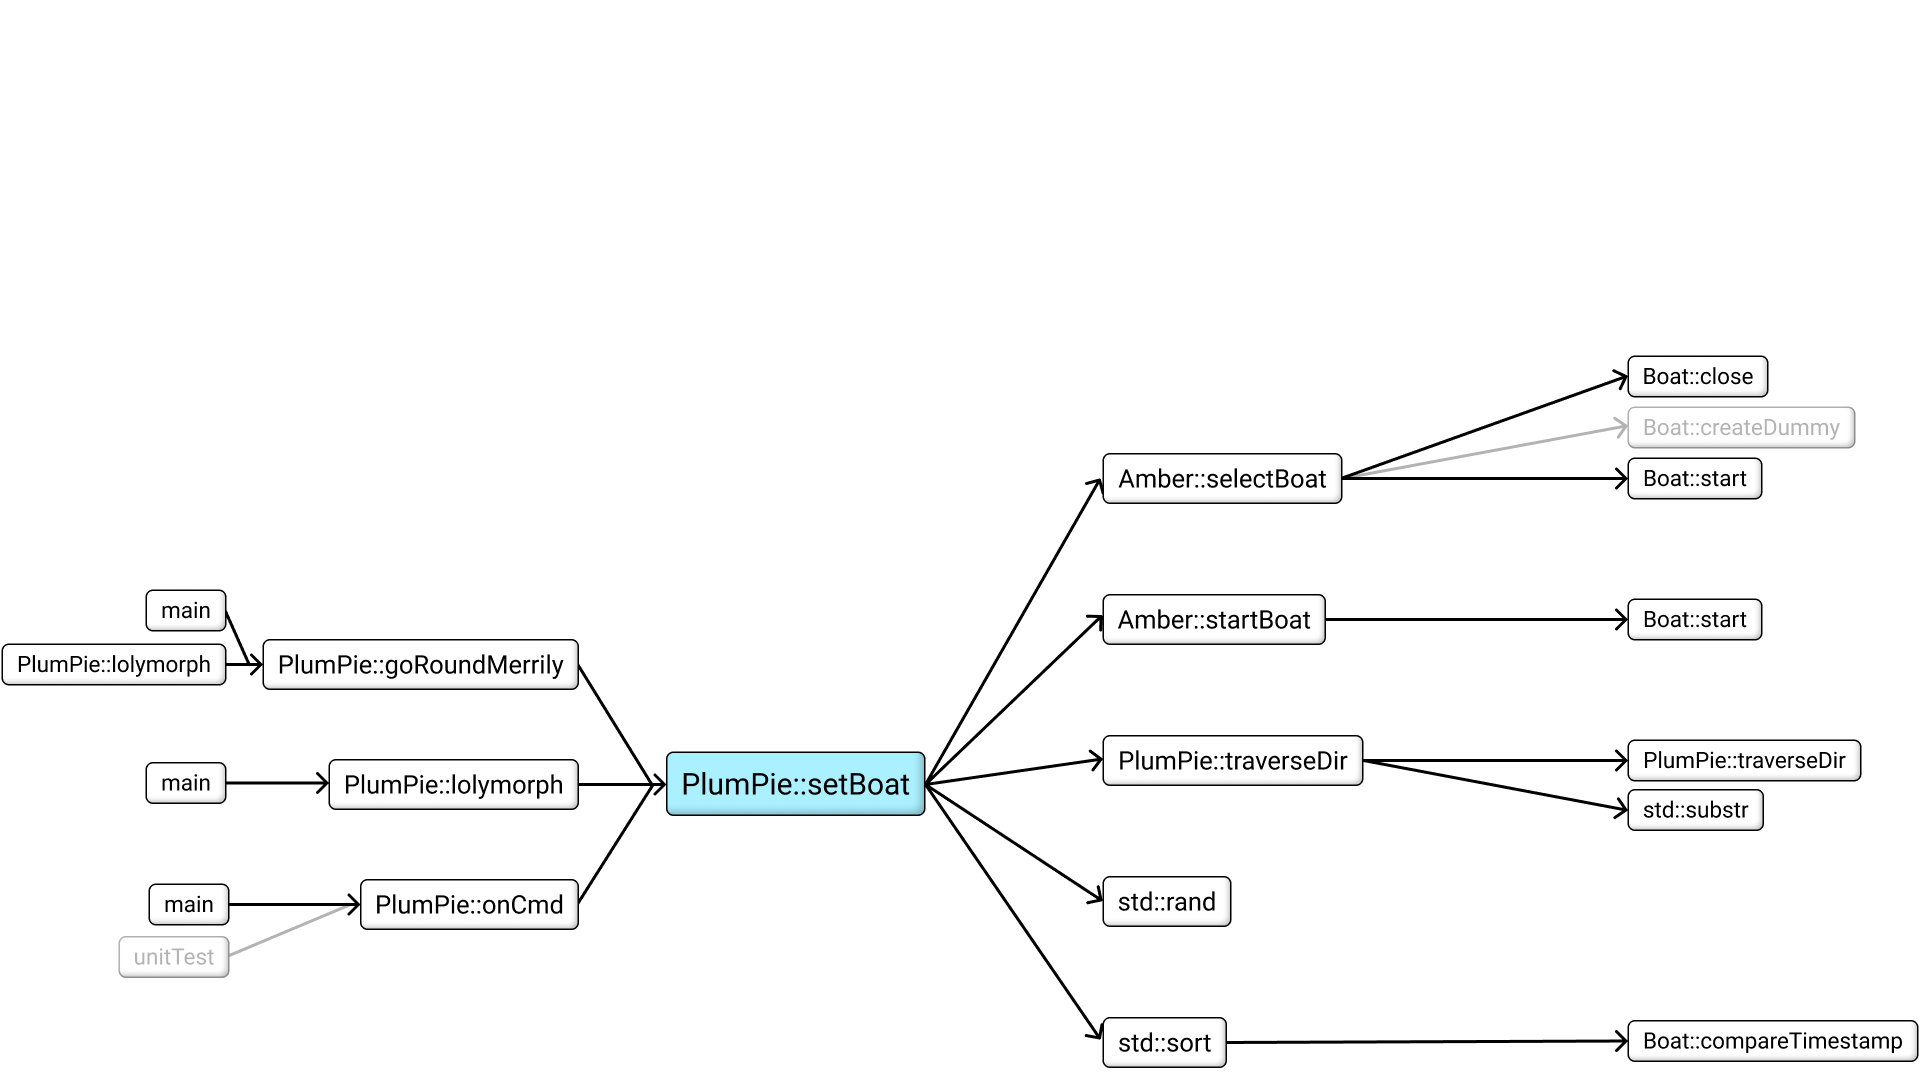
To further reduce complexity, are there any kind of functions the tool could hide from the graph? Yes, the ones that I have already put in gray. They are "unreachables" - what does that mean? Let's look at the original source code. Amber::selectBoat calls Boat::createDummy, but only if a certain condition is true. And that condition is never true when selectBoat is called from our current function, because of a hardcoded value, so the tool can come to this conclusion with static analysis. It doesn't mean that the function will never be called from anywhere in the whole program, it just means that the function will never be called from here. And here on the left side, "unitTest" is kinda the same thing but in reverse. unitTest does call PlumPie::onCmd, but in that case, onCmd never calls setBoat. There is no path from unitTest to setBoat. So we can click this option here to hide unreachables.
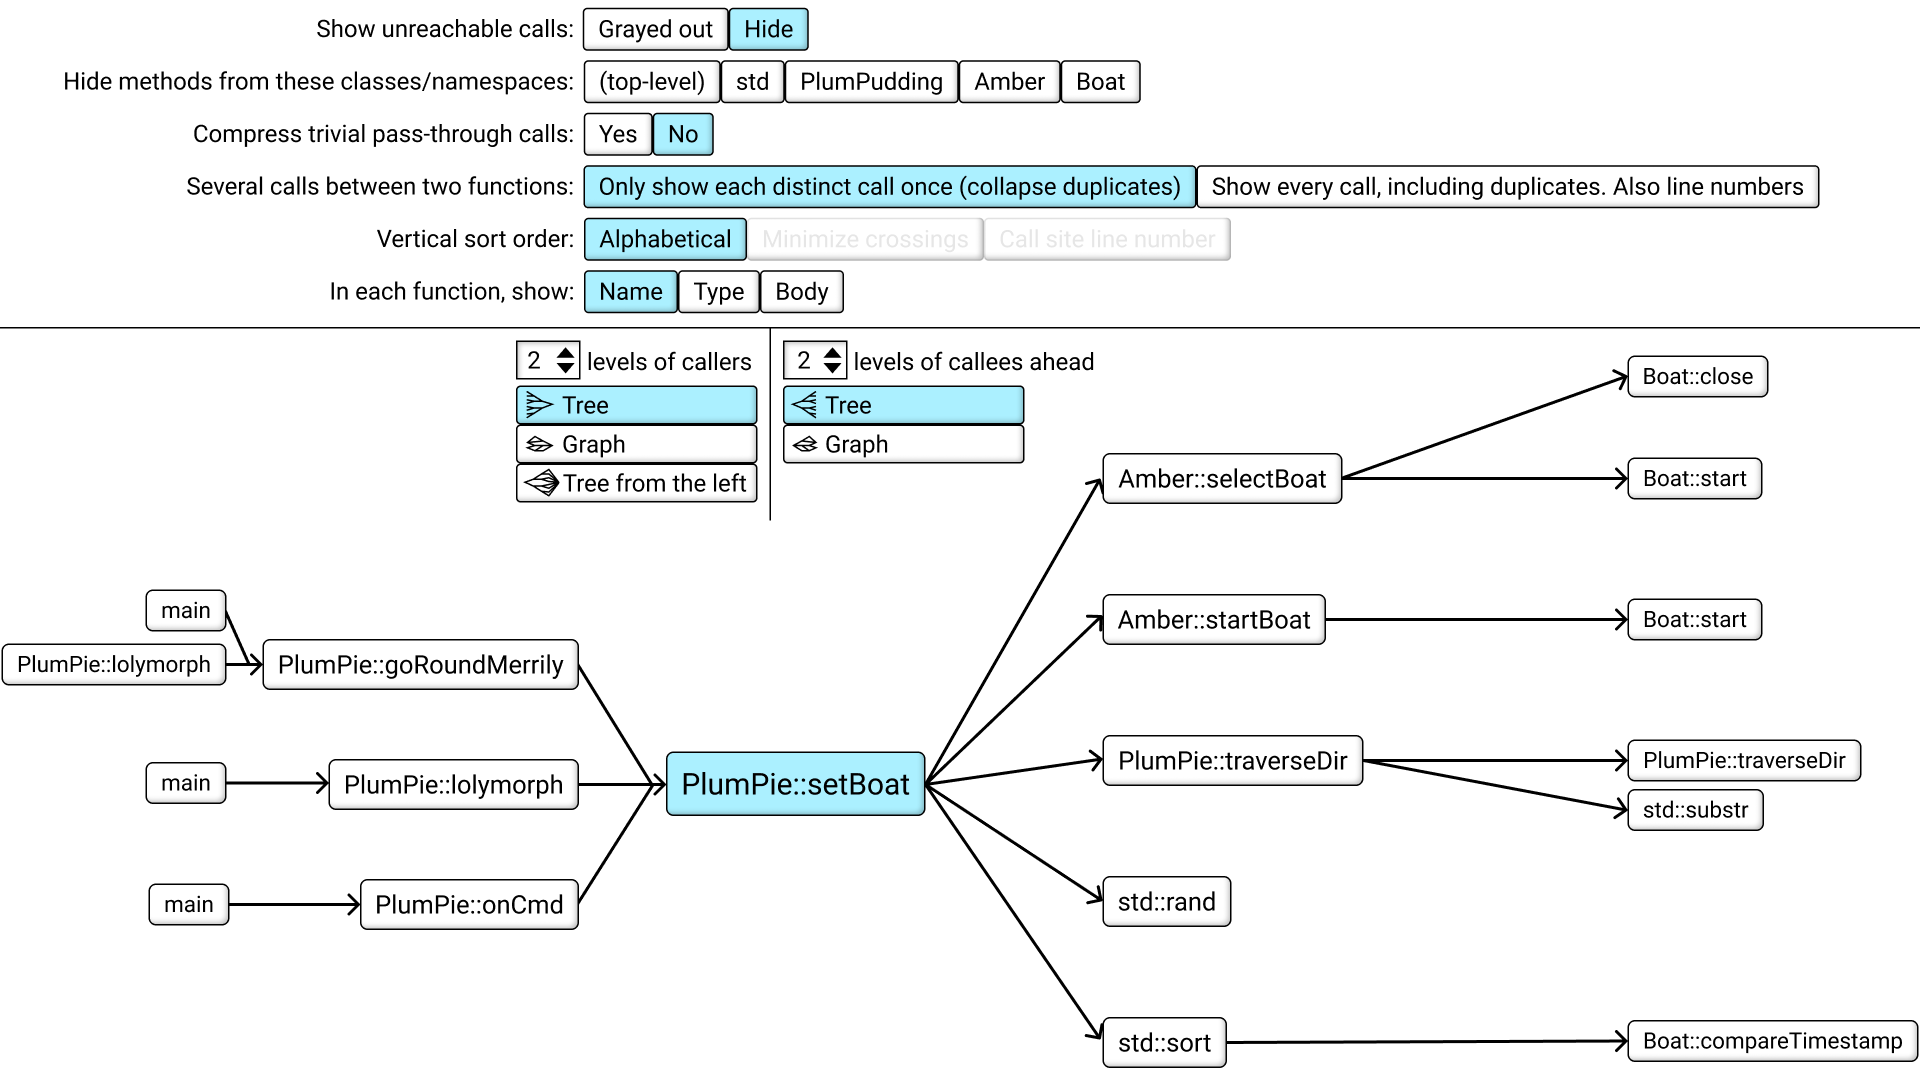
Next option. We can note that some functions in the graph are part of the standard library included with the programming language itself. So I think we need an option to hide those. The same kind of option could also be used to hide functions from certain files or namespaces or classes or assemblies or however your programming language likes to organize things.
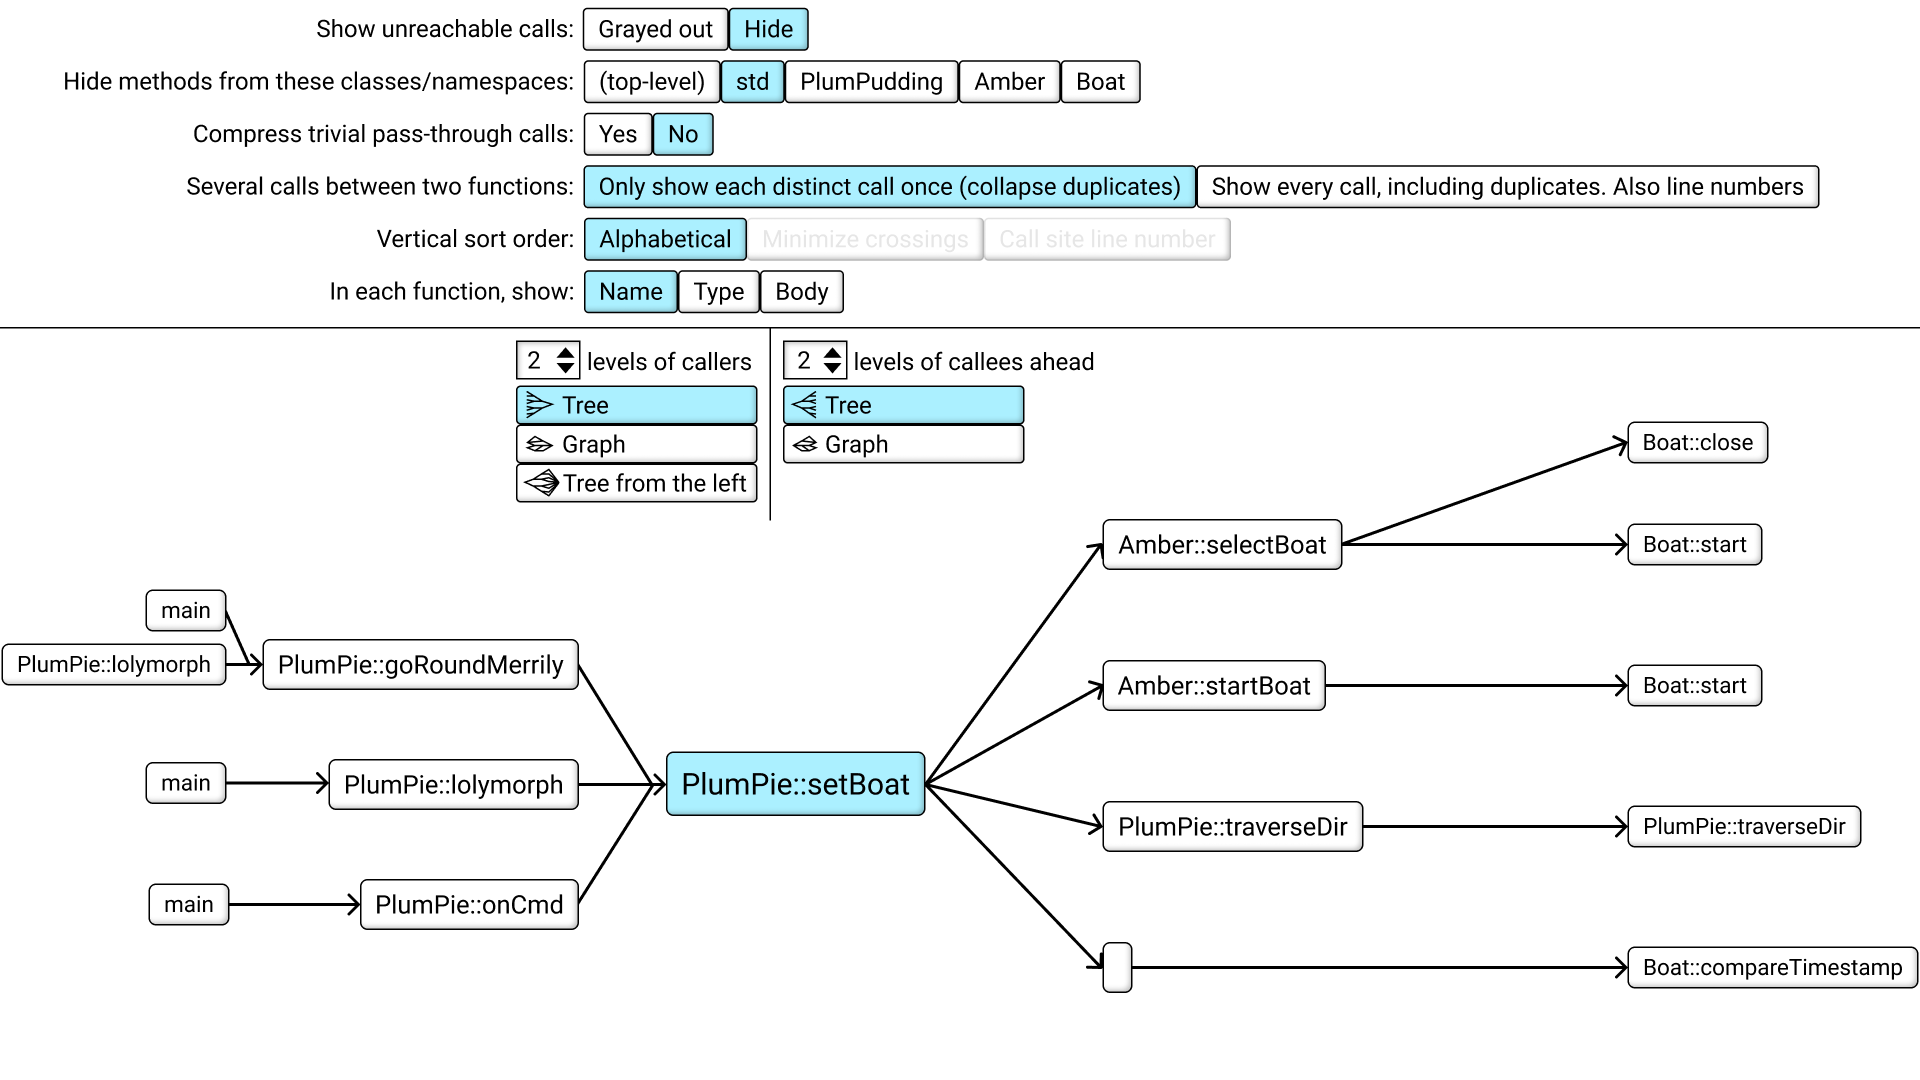
You might wonder about this guy. Why was "std::sort" not completely hidden but just turned into a small square? Let's look at the code. Sort is a standard library function, but we use it with a callback to our own code, so we call the standard library, but then the standard library calls our code, which we still want to see. I figured that the best design is to keep the chain but just shrink the node.
Next option. We can note that some functions don't really do anything except passing straight through to a different function. When I see code like this, it's often a sign that the code is bad and could be simplified, but nevertheless, such bad code exists out there and it's good if the tool can help us with it. So this option will hide functions that just pass straight through to another function.
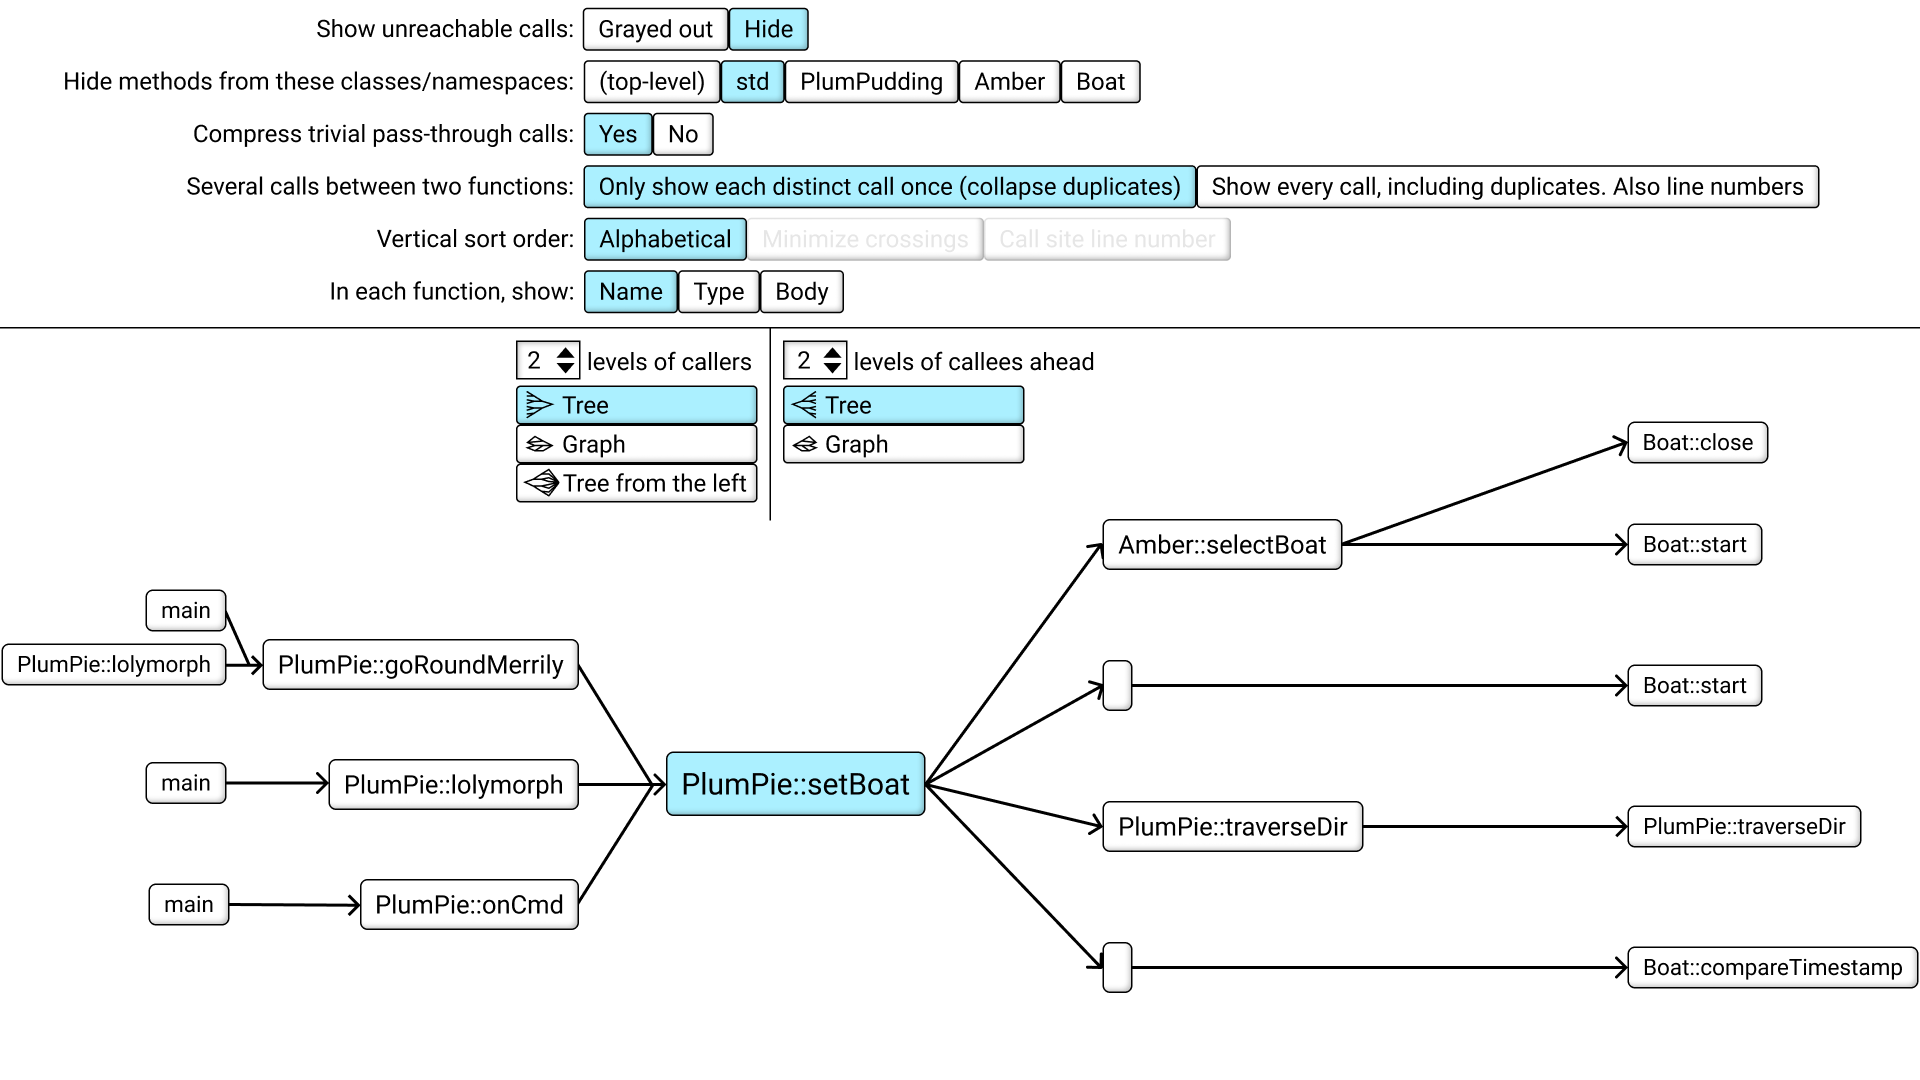
Next option. You see that the "main" function on the left here is written 3 times, why? And same with the Boat::start function on the right which is written twice. Of course, there is just one single "main" function in the code, but it's duplicated here in the viewer because we have chosen to view the callers as a tree. Each level of callers can branch out more and more, but they don't rejoin. I think we need an option to instead view it as a true graph, which can both branch out and rejoin.
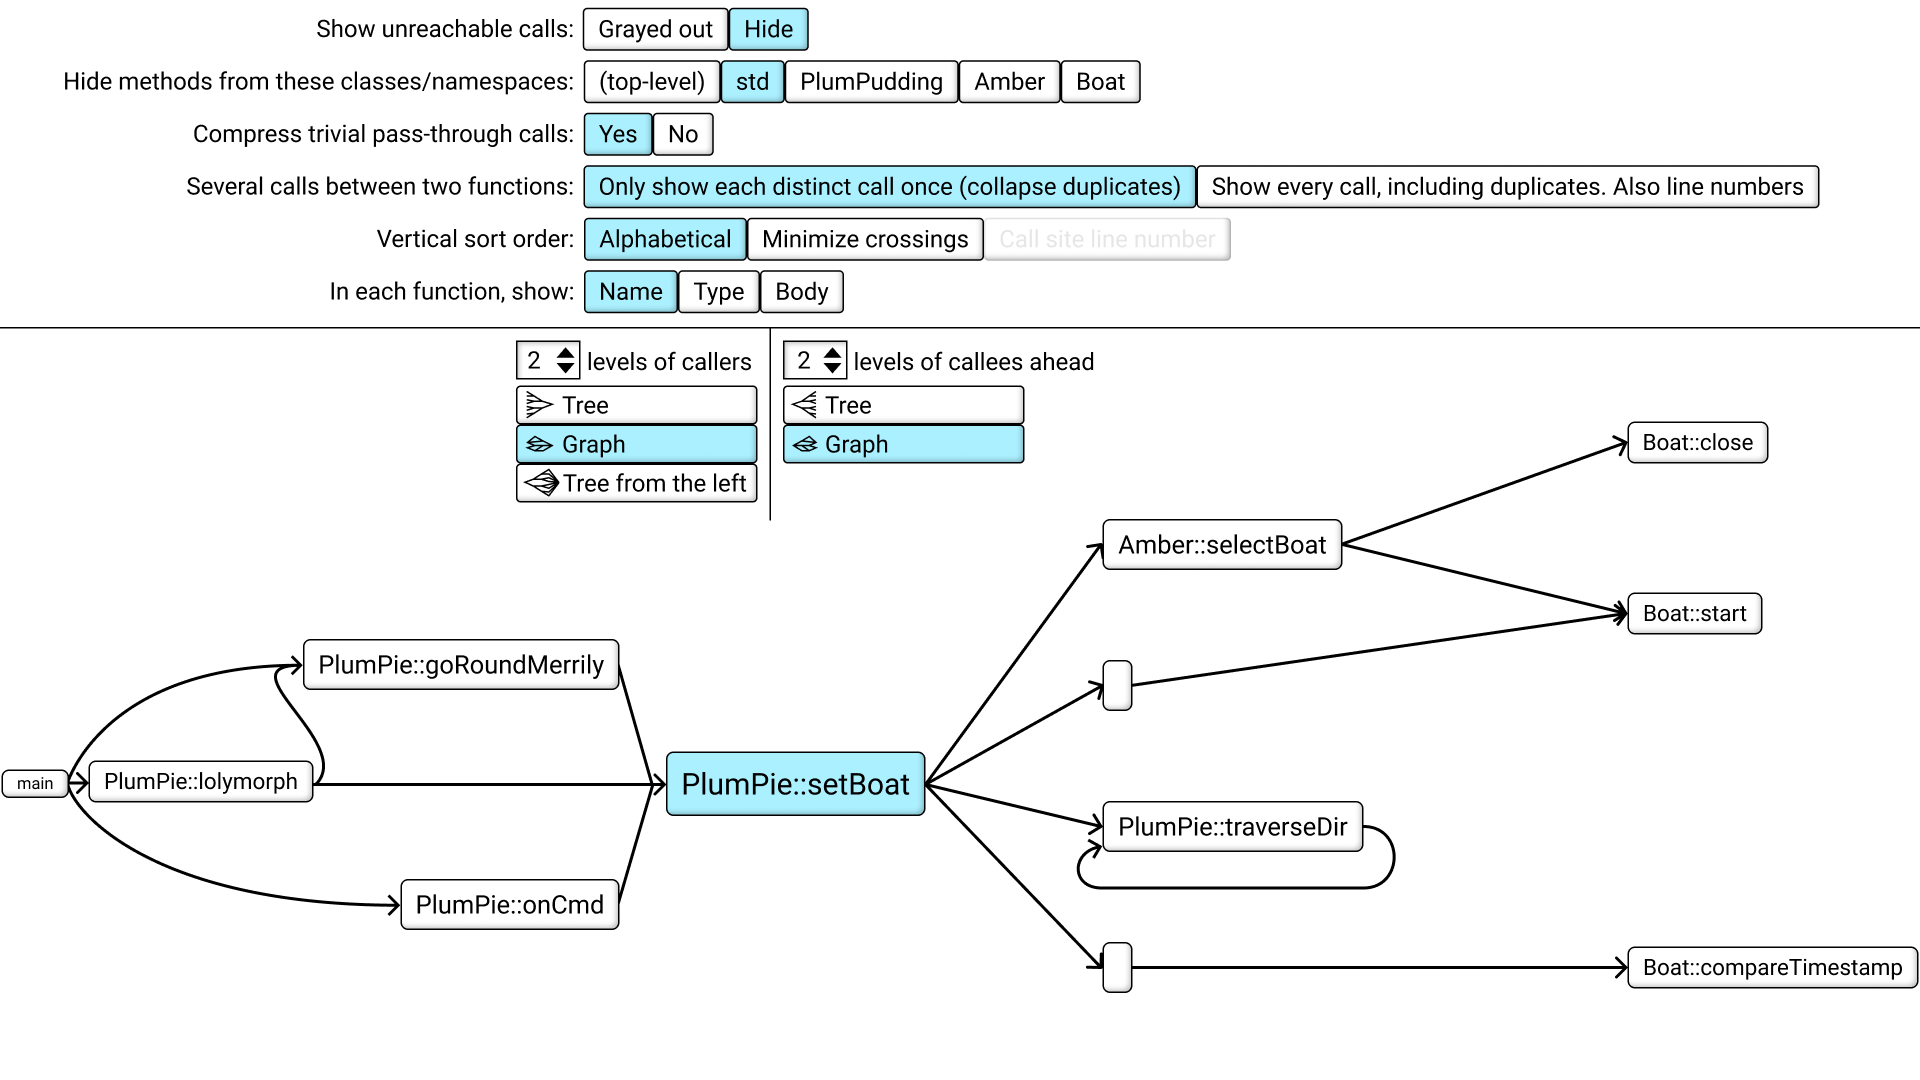
Now there is just one "main" and one "Boat::start". You can also see that the recursive function now has an arrow looping around and pointing at itself.
Next option. In this current view, you see that setBoat calls traverseDir, but if we look at the code, you can see that there are actually TWO such calls, not just one. The tool kinda collapsed them into one arrow for a simpler visualization, but there should be an option to see every call individually. This also turns on line numbers. We show the line number where the call happens.
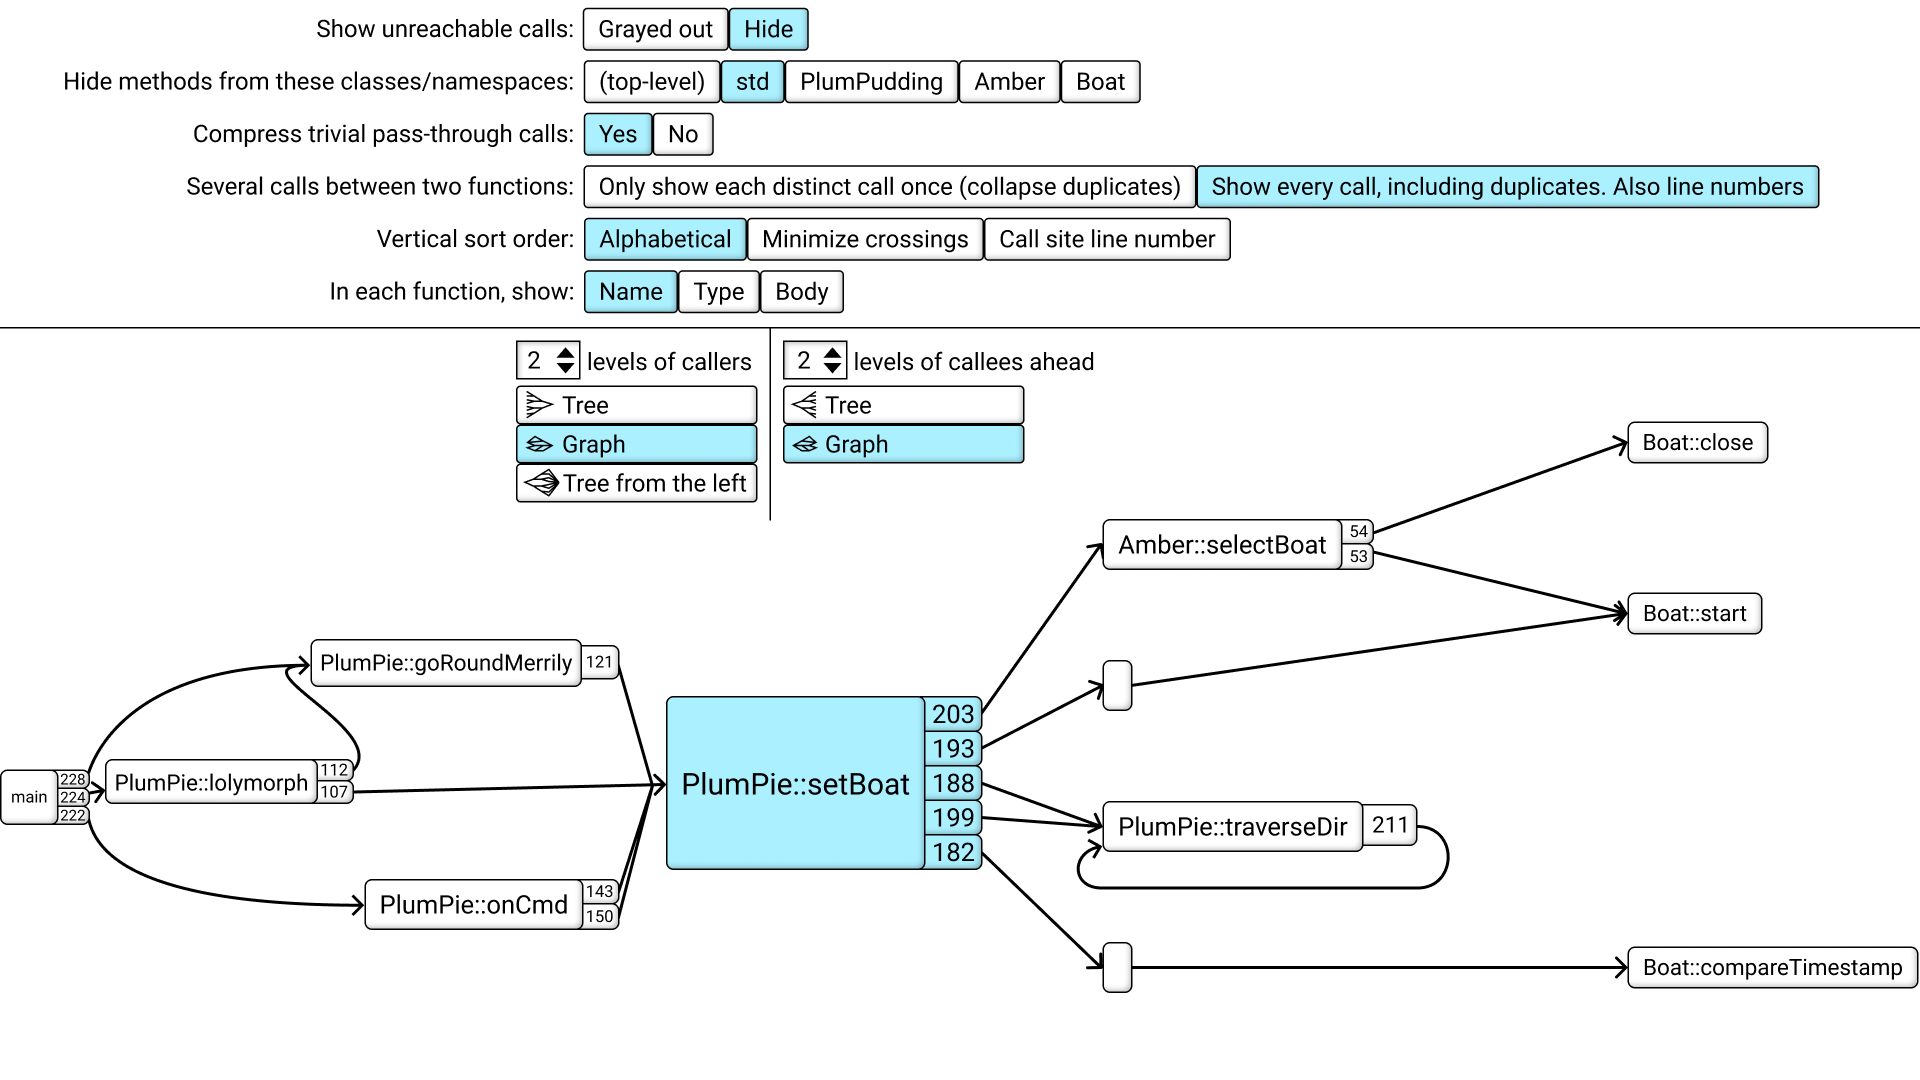
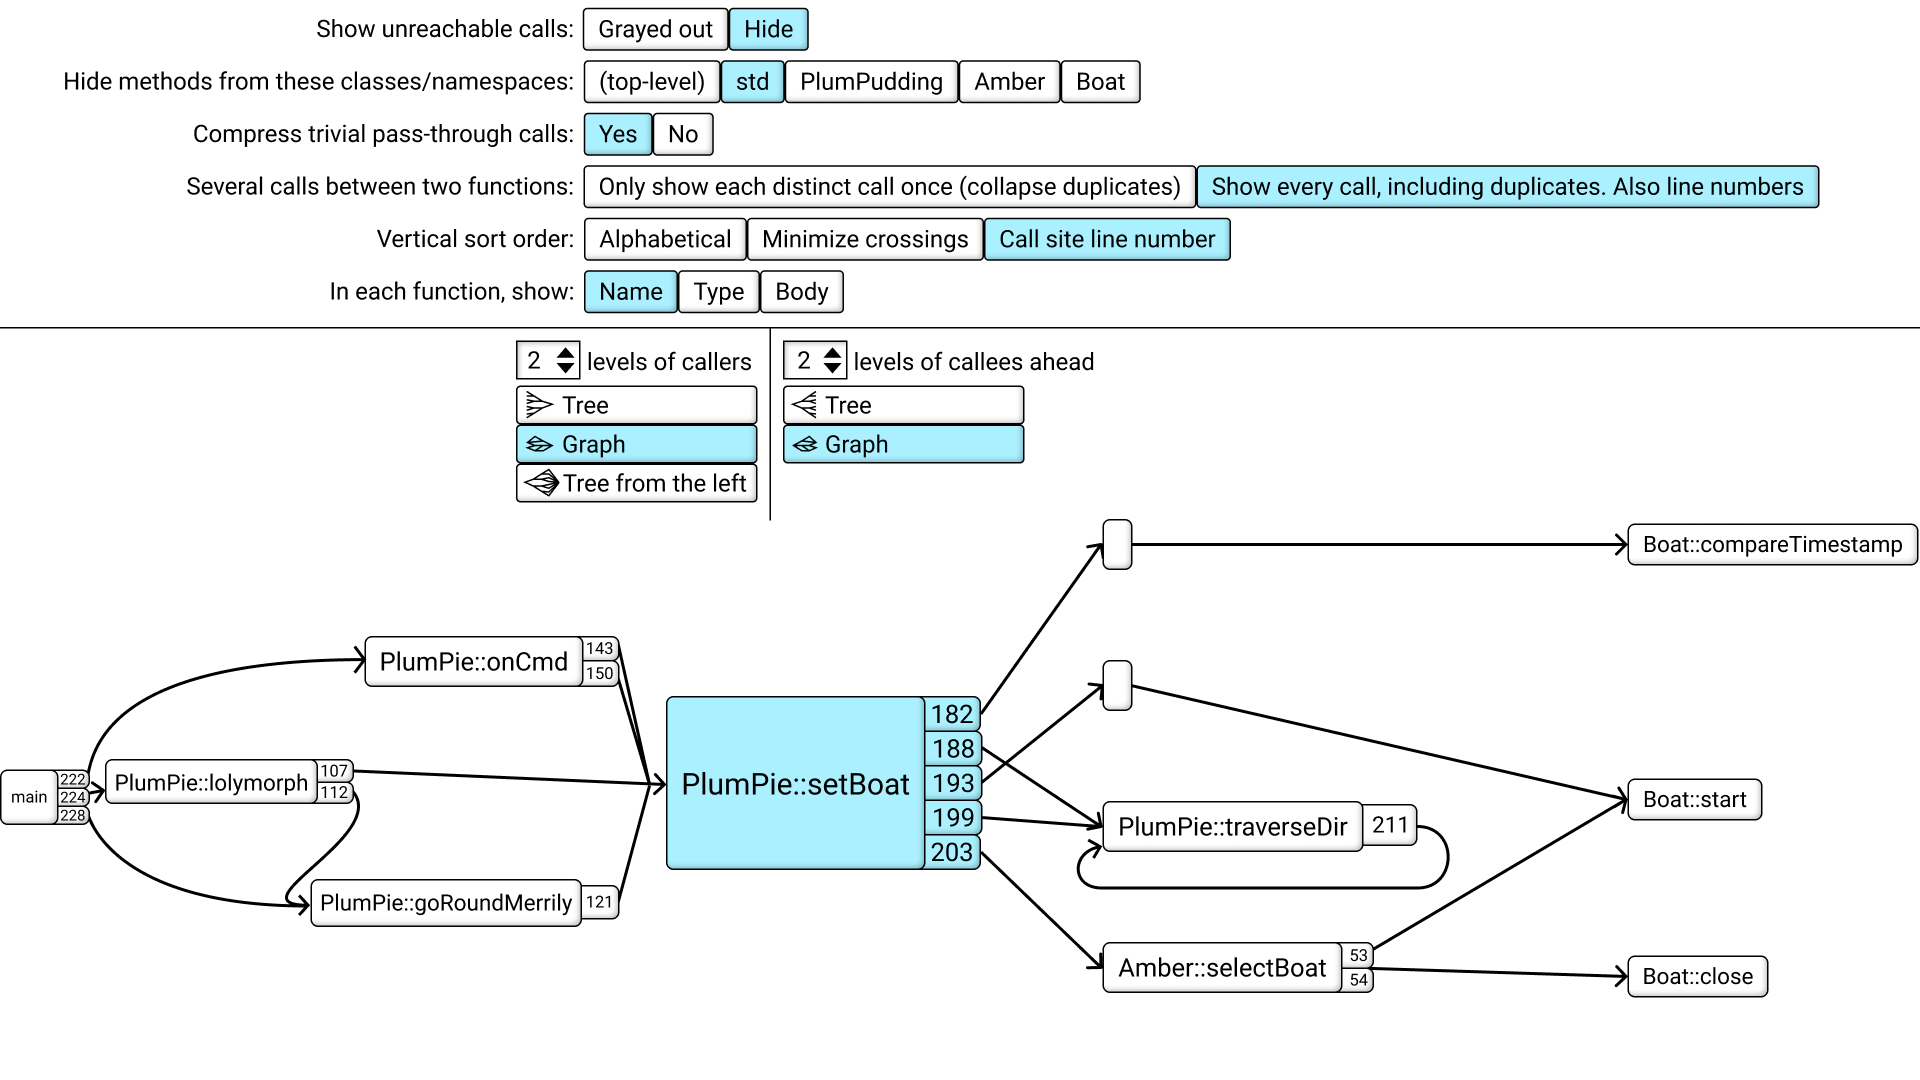
This makes us think about - why are the callees and callers sorted in the order they currently are, from top to bottom? This option has been here from the start, specifying that they should be sorted alphabetically. But now that we see line numbers, it opens up the option to instead sort by line number. Of course, this might cause the layout to look messier - you can get arrows crossing each other. This could actually happen with alphabetical sorting too, it just didn't happen in our example. So there is a third option to layout the graph to minimize the number of crossing arrows.
For our final option, let's think about the nodes in this graph. Currently each node just shows the class and function name. It should be possible to see other things inside the node, like the whole function signature including arguments and return value types, or even the whole function body, with the font size scaled like the idea in my previous video.
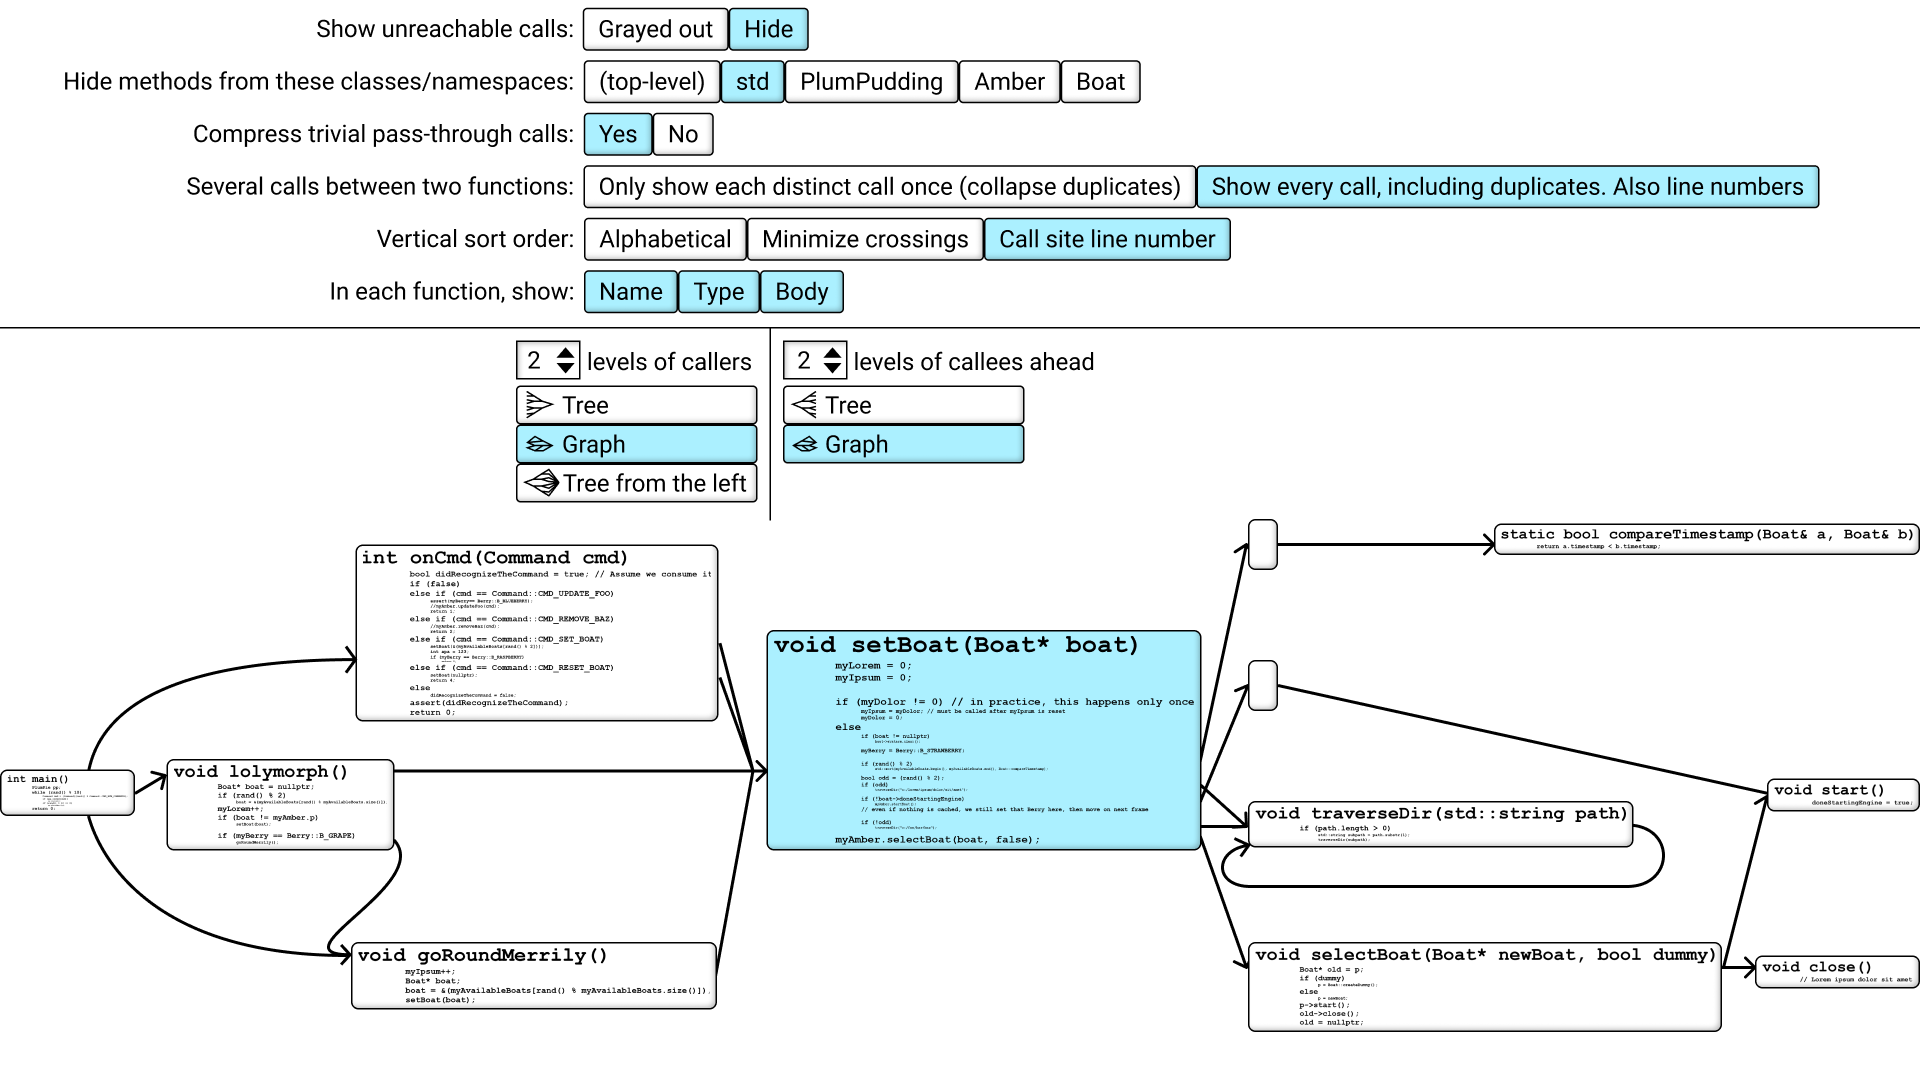
This also suggests to me that, instead of showing the call graph in split-screen with your text editor on the other side, we could instead toggle the view, so you could zoom out from your text editor to this view, and then jump to another function, and then zoom in to that.
That's all I have for the main prototype so far. But let's also address a few concerns you might have.
First, what about keyboard navigation? This is a very graphical user interface, and in the prototype I'm using the mouse to navigate. But many programmers, including myself, like to use the mouse as little as possible and use the keyboard as much as possible because our workflow is faster that way. And my answer is that yes of course this call graph navigator should support fast and efficient keyboard navigation. But I'm not sure exactly how, yet. One idea is to select a caller or callee using the arrow keys or vim-style HJKL keys. Another idea is to number the callers from top to bottom and let you type in the number.
A third idea is that the tool could automatically choose some unique letters in each function name, as few as possible like just one or two letters, and let you type them to jump to that function. I'm not sure what's best, it would need to be tested.
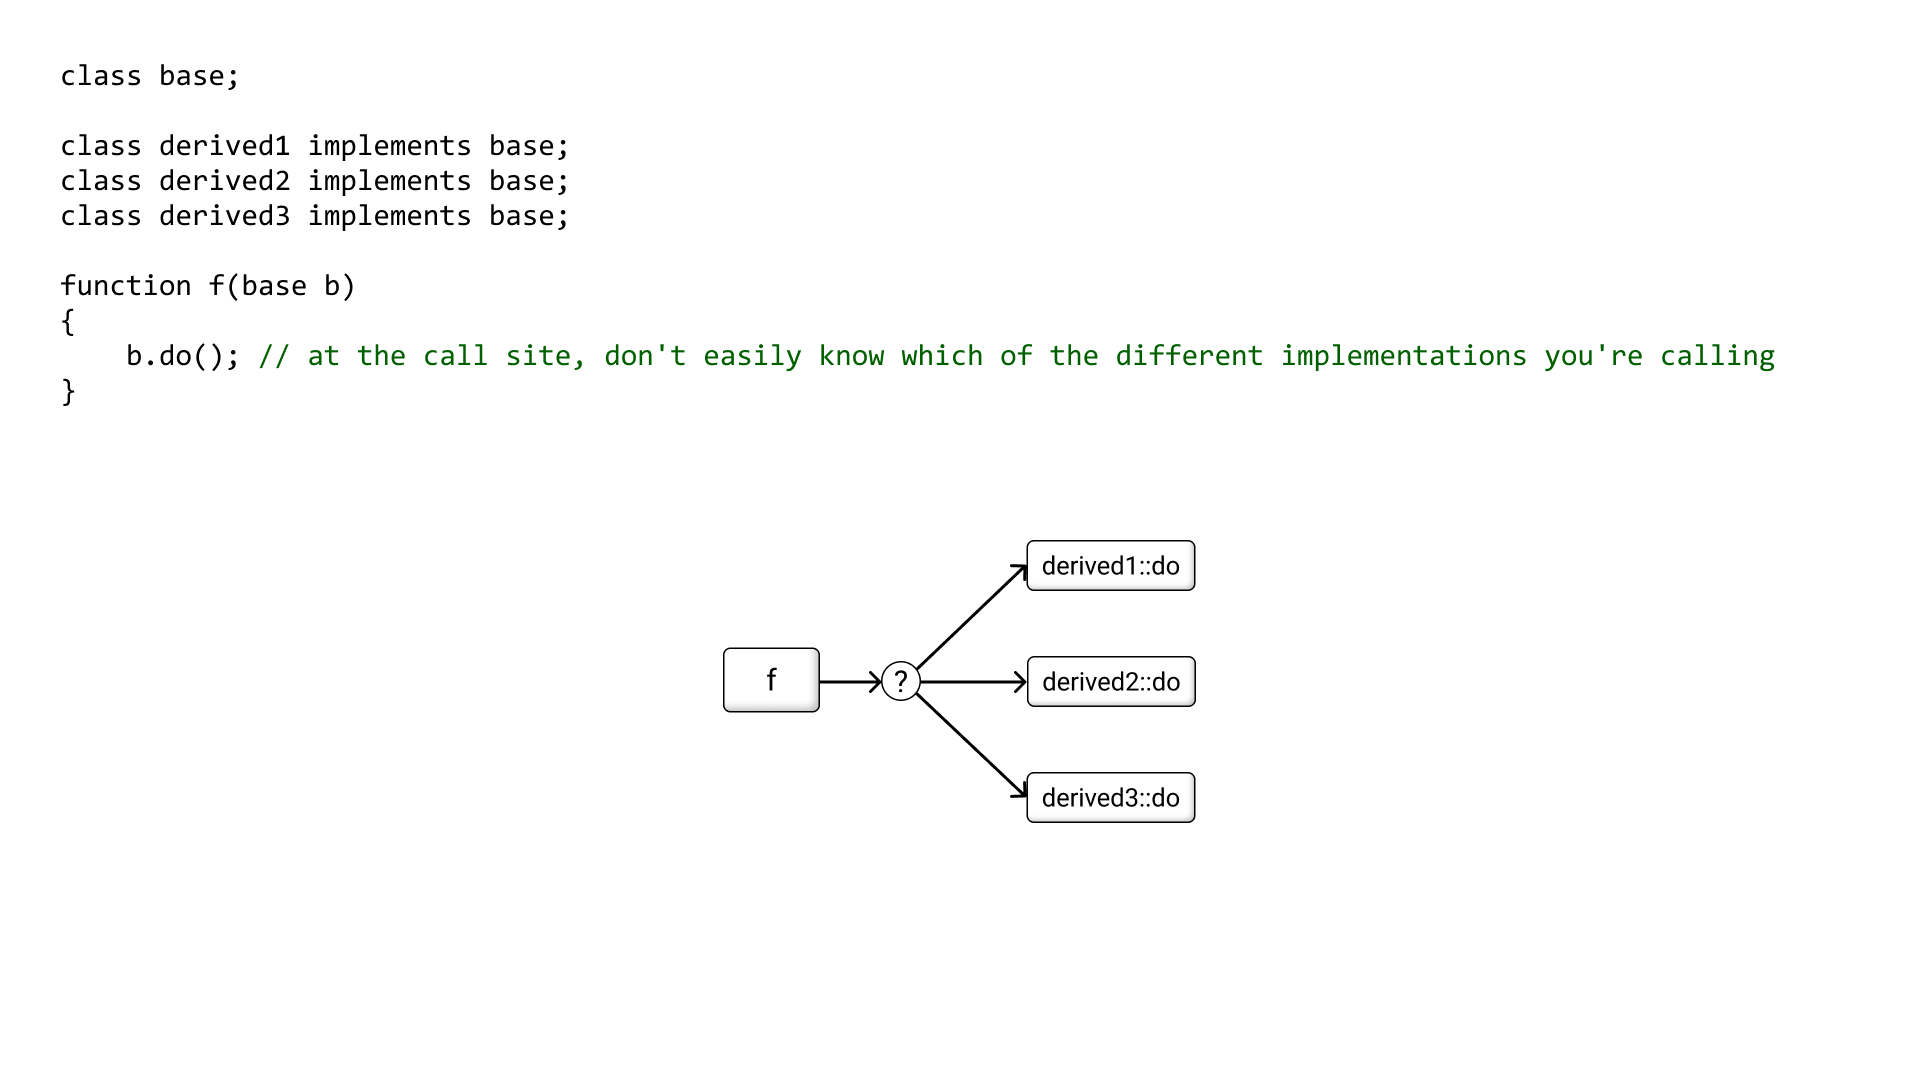
Second concern, what about virtual function calls, function pointers, any kind of dynamic dispatch? Yes, you're right, this visualization will work best for programs with a very static call graph. The more dynamic the program, the less this tool will help. For example, if you have a base class with several derived classes, or in the terminology of some other programming languages, if you have an interface with several implementations, the problem is that at the call site, where you call a function in that interface, you don't easily know which of the different implementations you're calling. In some cases the implementation doesn't even exist yet. Maybe you're writing code which other people will later plug in an implementation into. So it's impossible for the tool to know the complete call graph in some situations, but that said, there are still some things the tool could do to help in many situations.
The tool could find all implementations that currently exist inside your code base, and show something like this, with a question mark to illustrate uncertainty. It knows that one of these functions will be called, but can't decide which one.
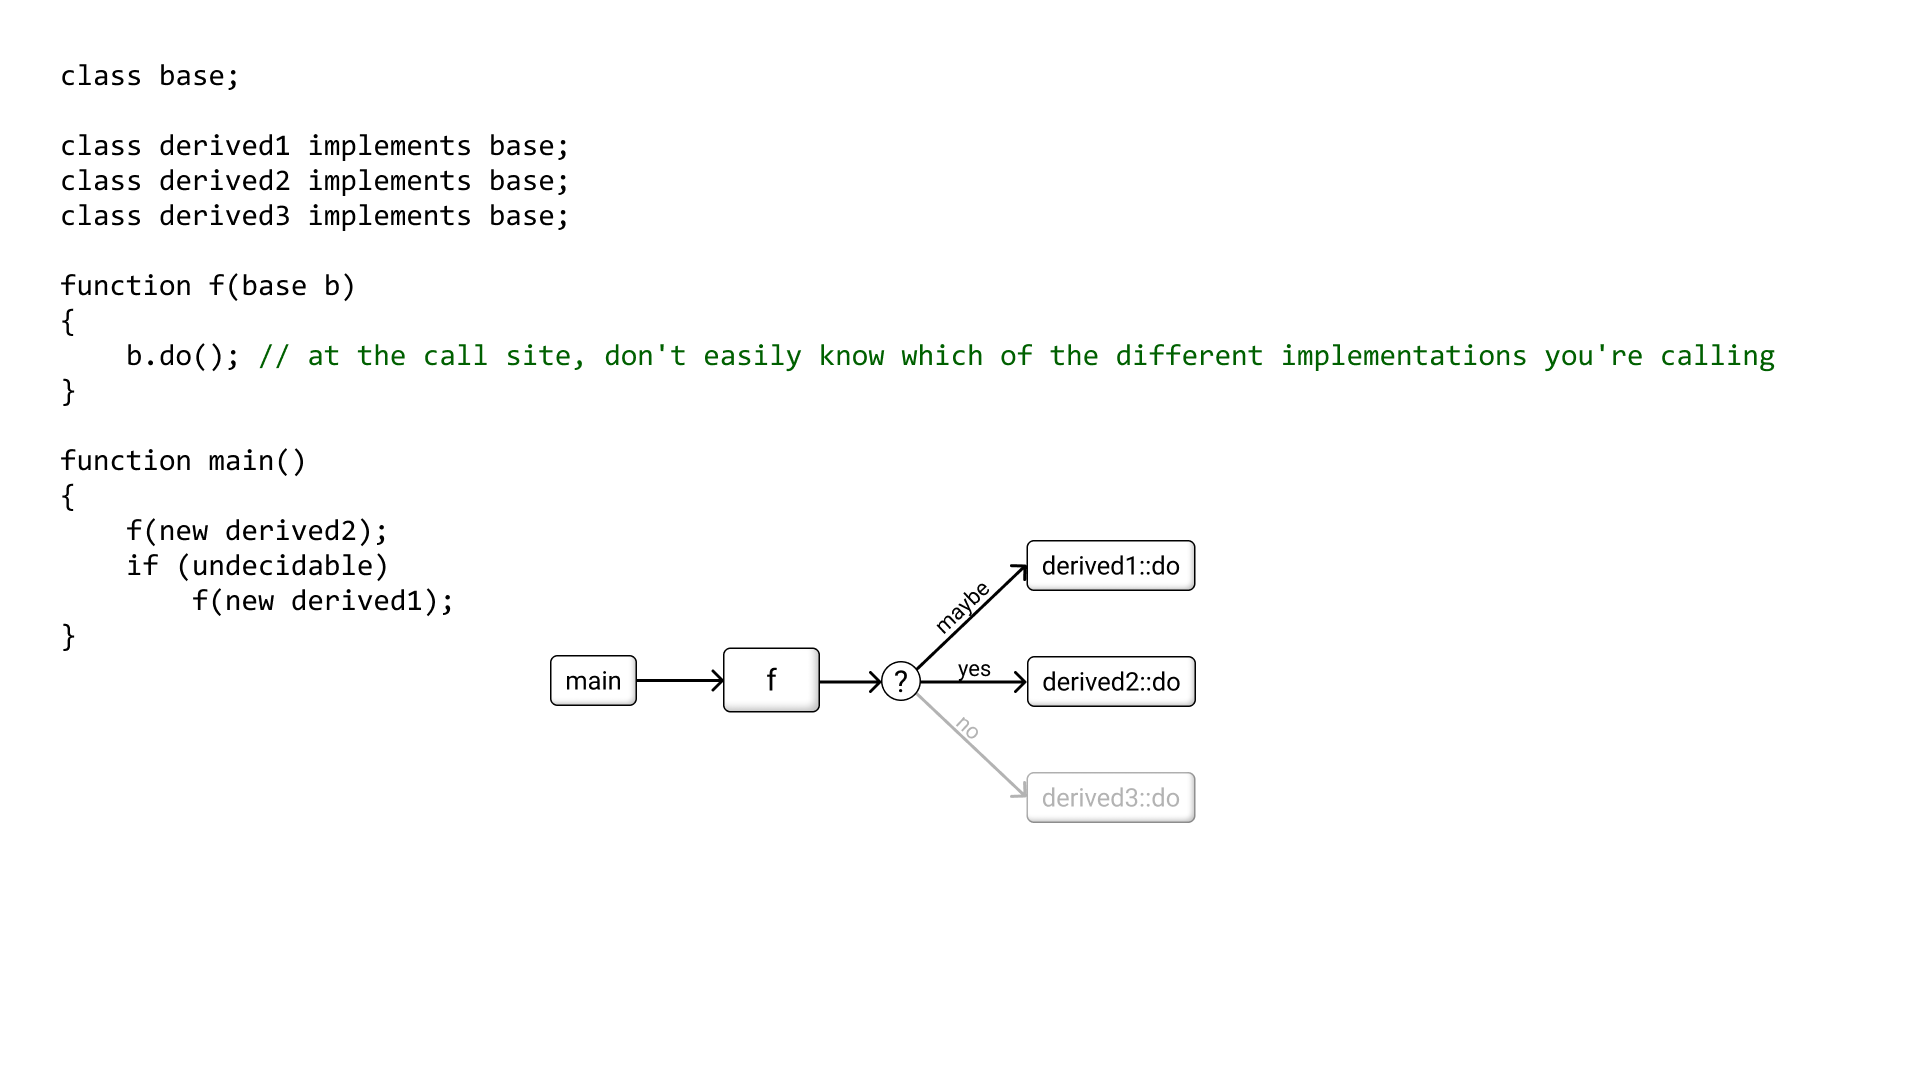
Additionally, the tool could learn a bit more through static analysis and runtime analysis. In some cases, not all but in some cases, it IS possible through static analysis to determine that some of these functions will definitely be called at this particular call site. It's a clear "yes". Or sometimes, the tool can statically determine that a function will never be called here. It's a clear "no". Or, the tool can't statically decide either way - the function is a "maybe". Then, a static "maybe" can become a "yes" through runtime analysis. So although there are two different ways to get to a "yes", in the end there are just 3 possible outcomes: yes, no and maybe. The tool could illustrate them somehow. I haven't thought deeply about this area yet, but "no"-functions could be shown grayed out or something.
Third concern, what if there are a hundred callers? A thousand? At some point we can no longer fit all callers on screen with a readable font size. All existing tools I tested would have you zoom and pan around in the static graph. But since a computer screen is not a sheet of paper, we can do better! The objects could move relative to one another. Here, we scroll up and down in the list of callers, but even if they are a thousand, the current function never needs to leave the center of the screen. And the lists one step further out, they can sort of stack up against the edge of the screen for a while before they leave it. Zooming should also be improved in a similar way.
Ok, I've told you all my ideas for a good call graph navigator. I've tried to be constructive, and if you found this interesting, I challenge you to also be constructive. How would you make this tool even better? Please let me know.